
Waste and circular economy progress
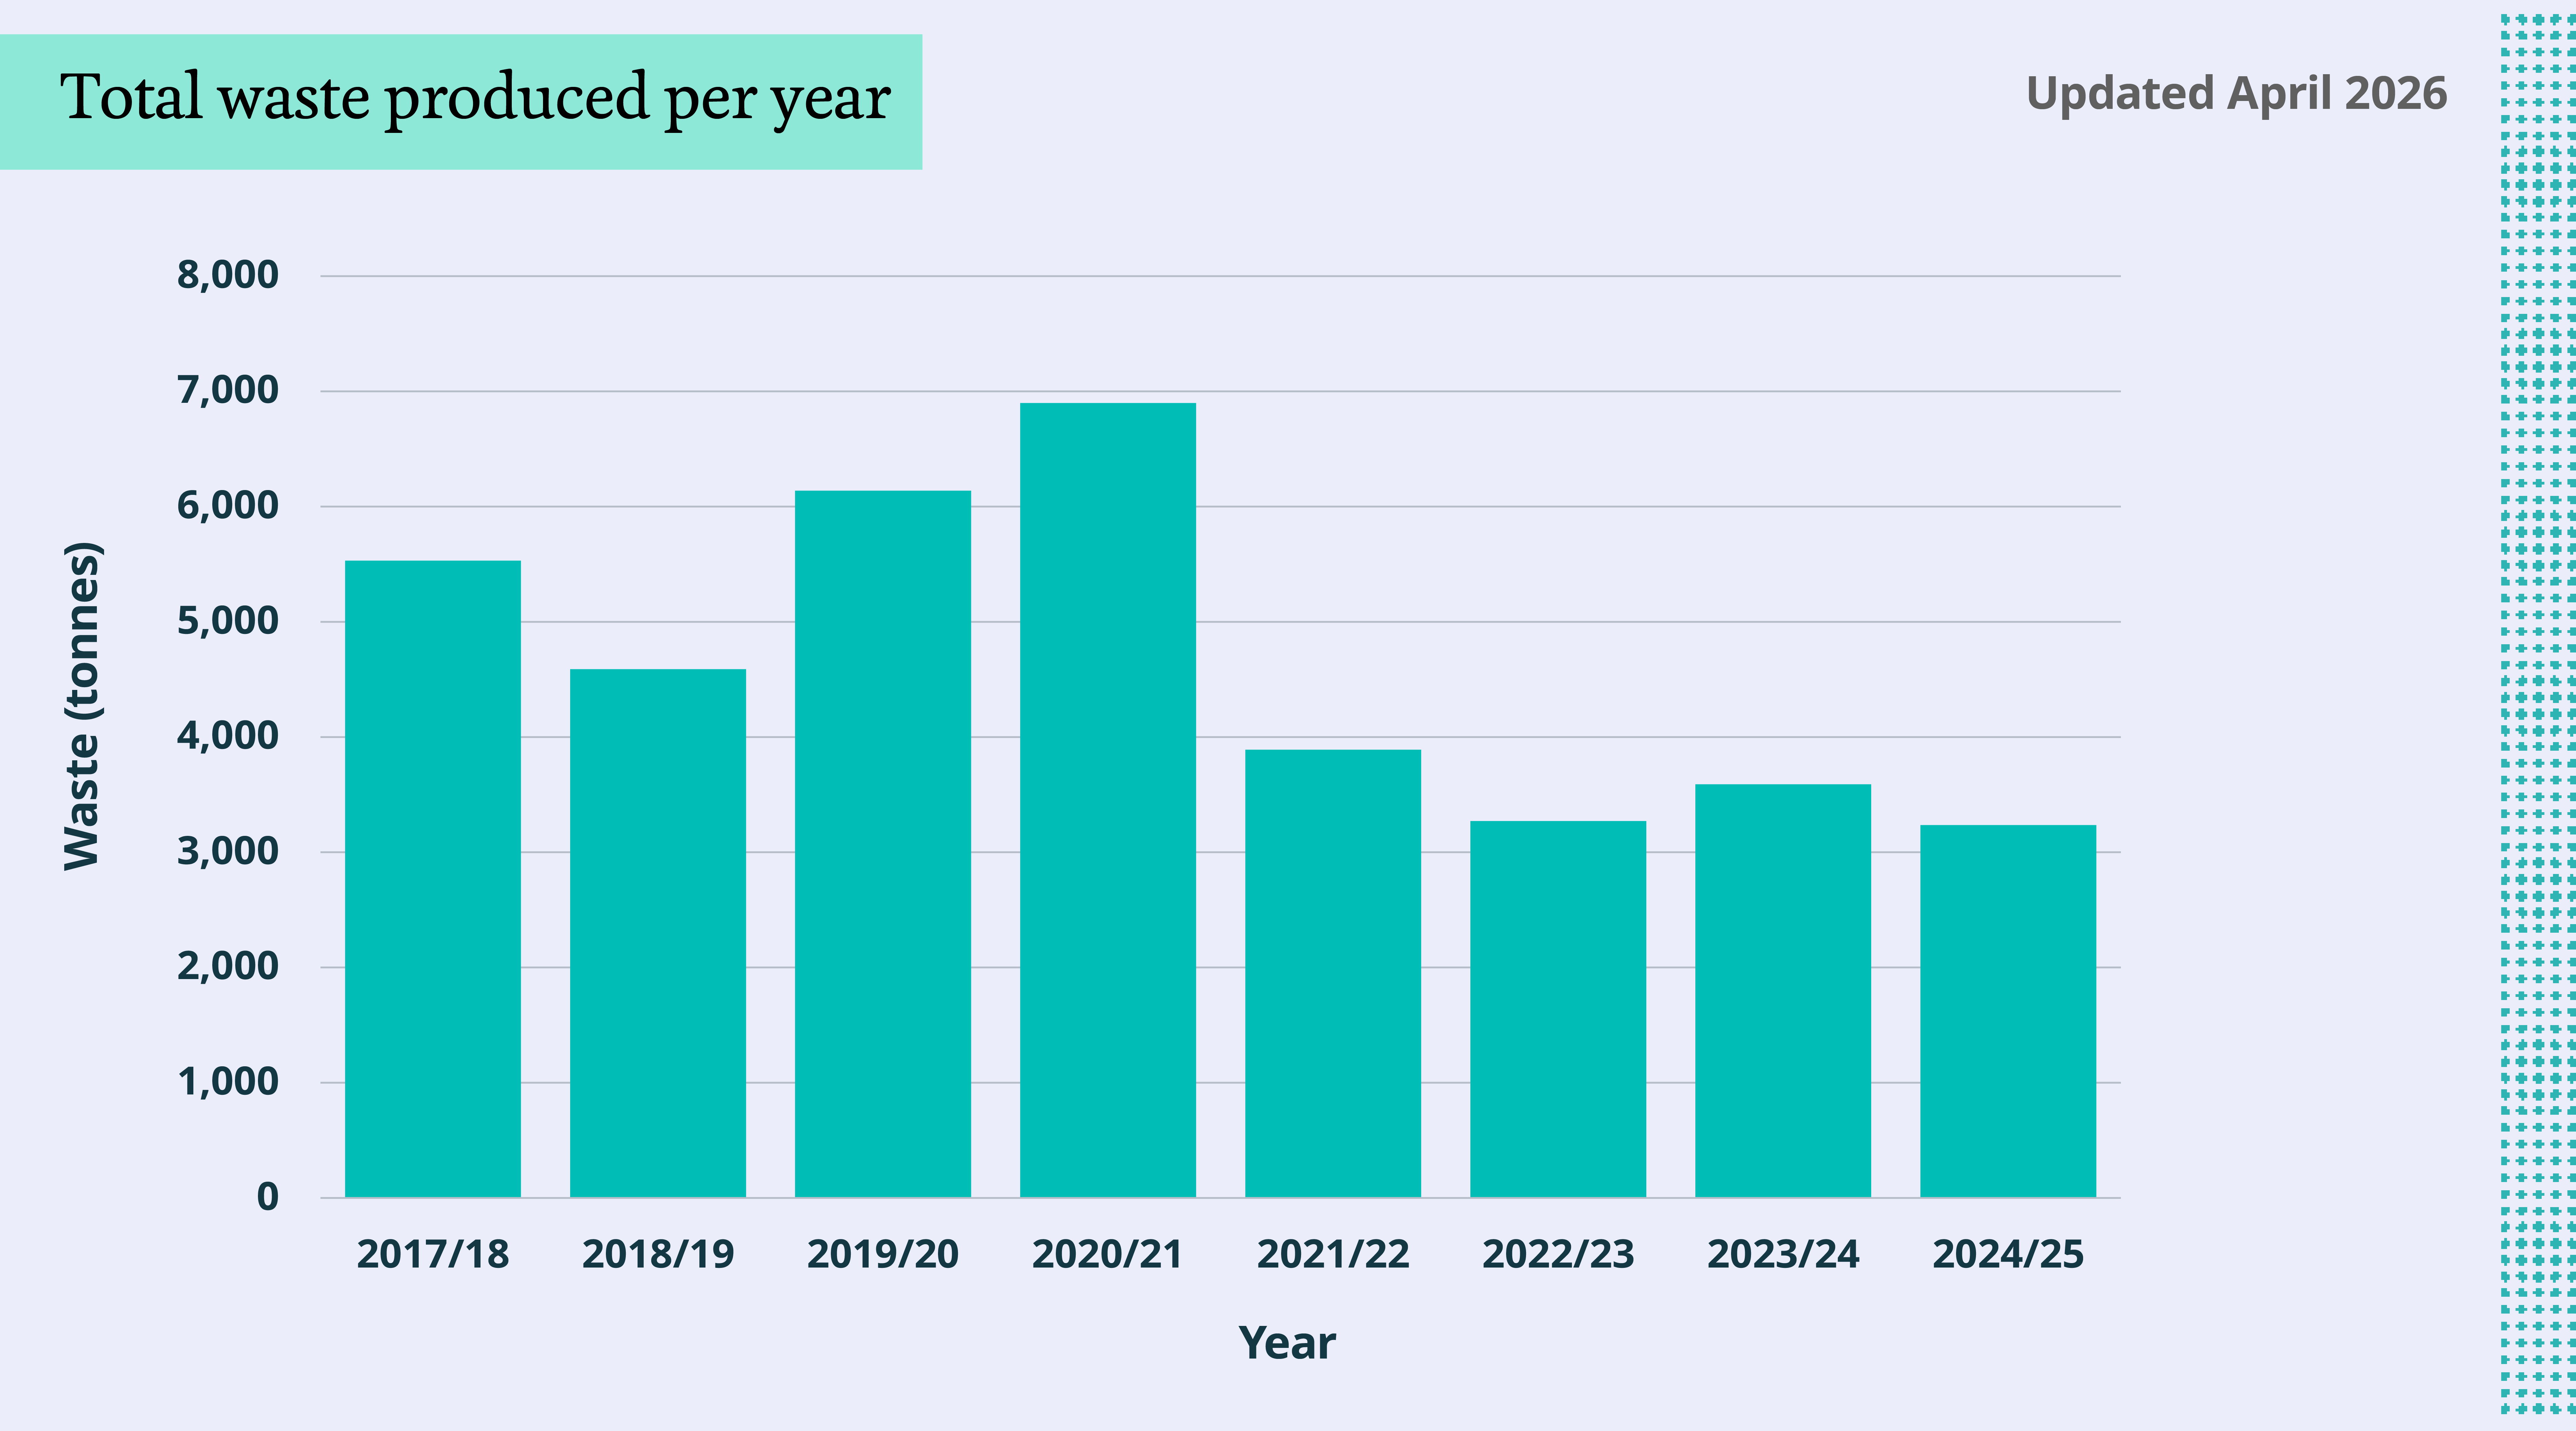
Total waste produced per year
The following graph shows the total waste produced on the University's operational estate between 2017-18 and 2024-25 in tonnes.
Summary
- There has been a significant decline in the total amount of waste produced annually since 2020-21.
- The large decrease in waste since the peak in 2020-21 is largely due to less construction waste as a result of fewer building projects. In future years we anticipate this downward trend in construction waste generation to continue as the University's Reshaping Our Estate programme should result in fewer new build projects.
Note
- Hazardous waste has only been included in our total waste data since 2022-23.
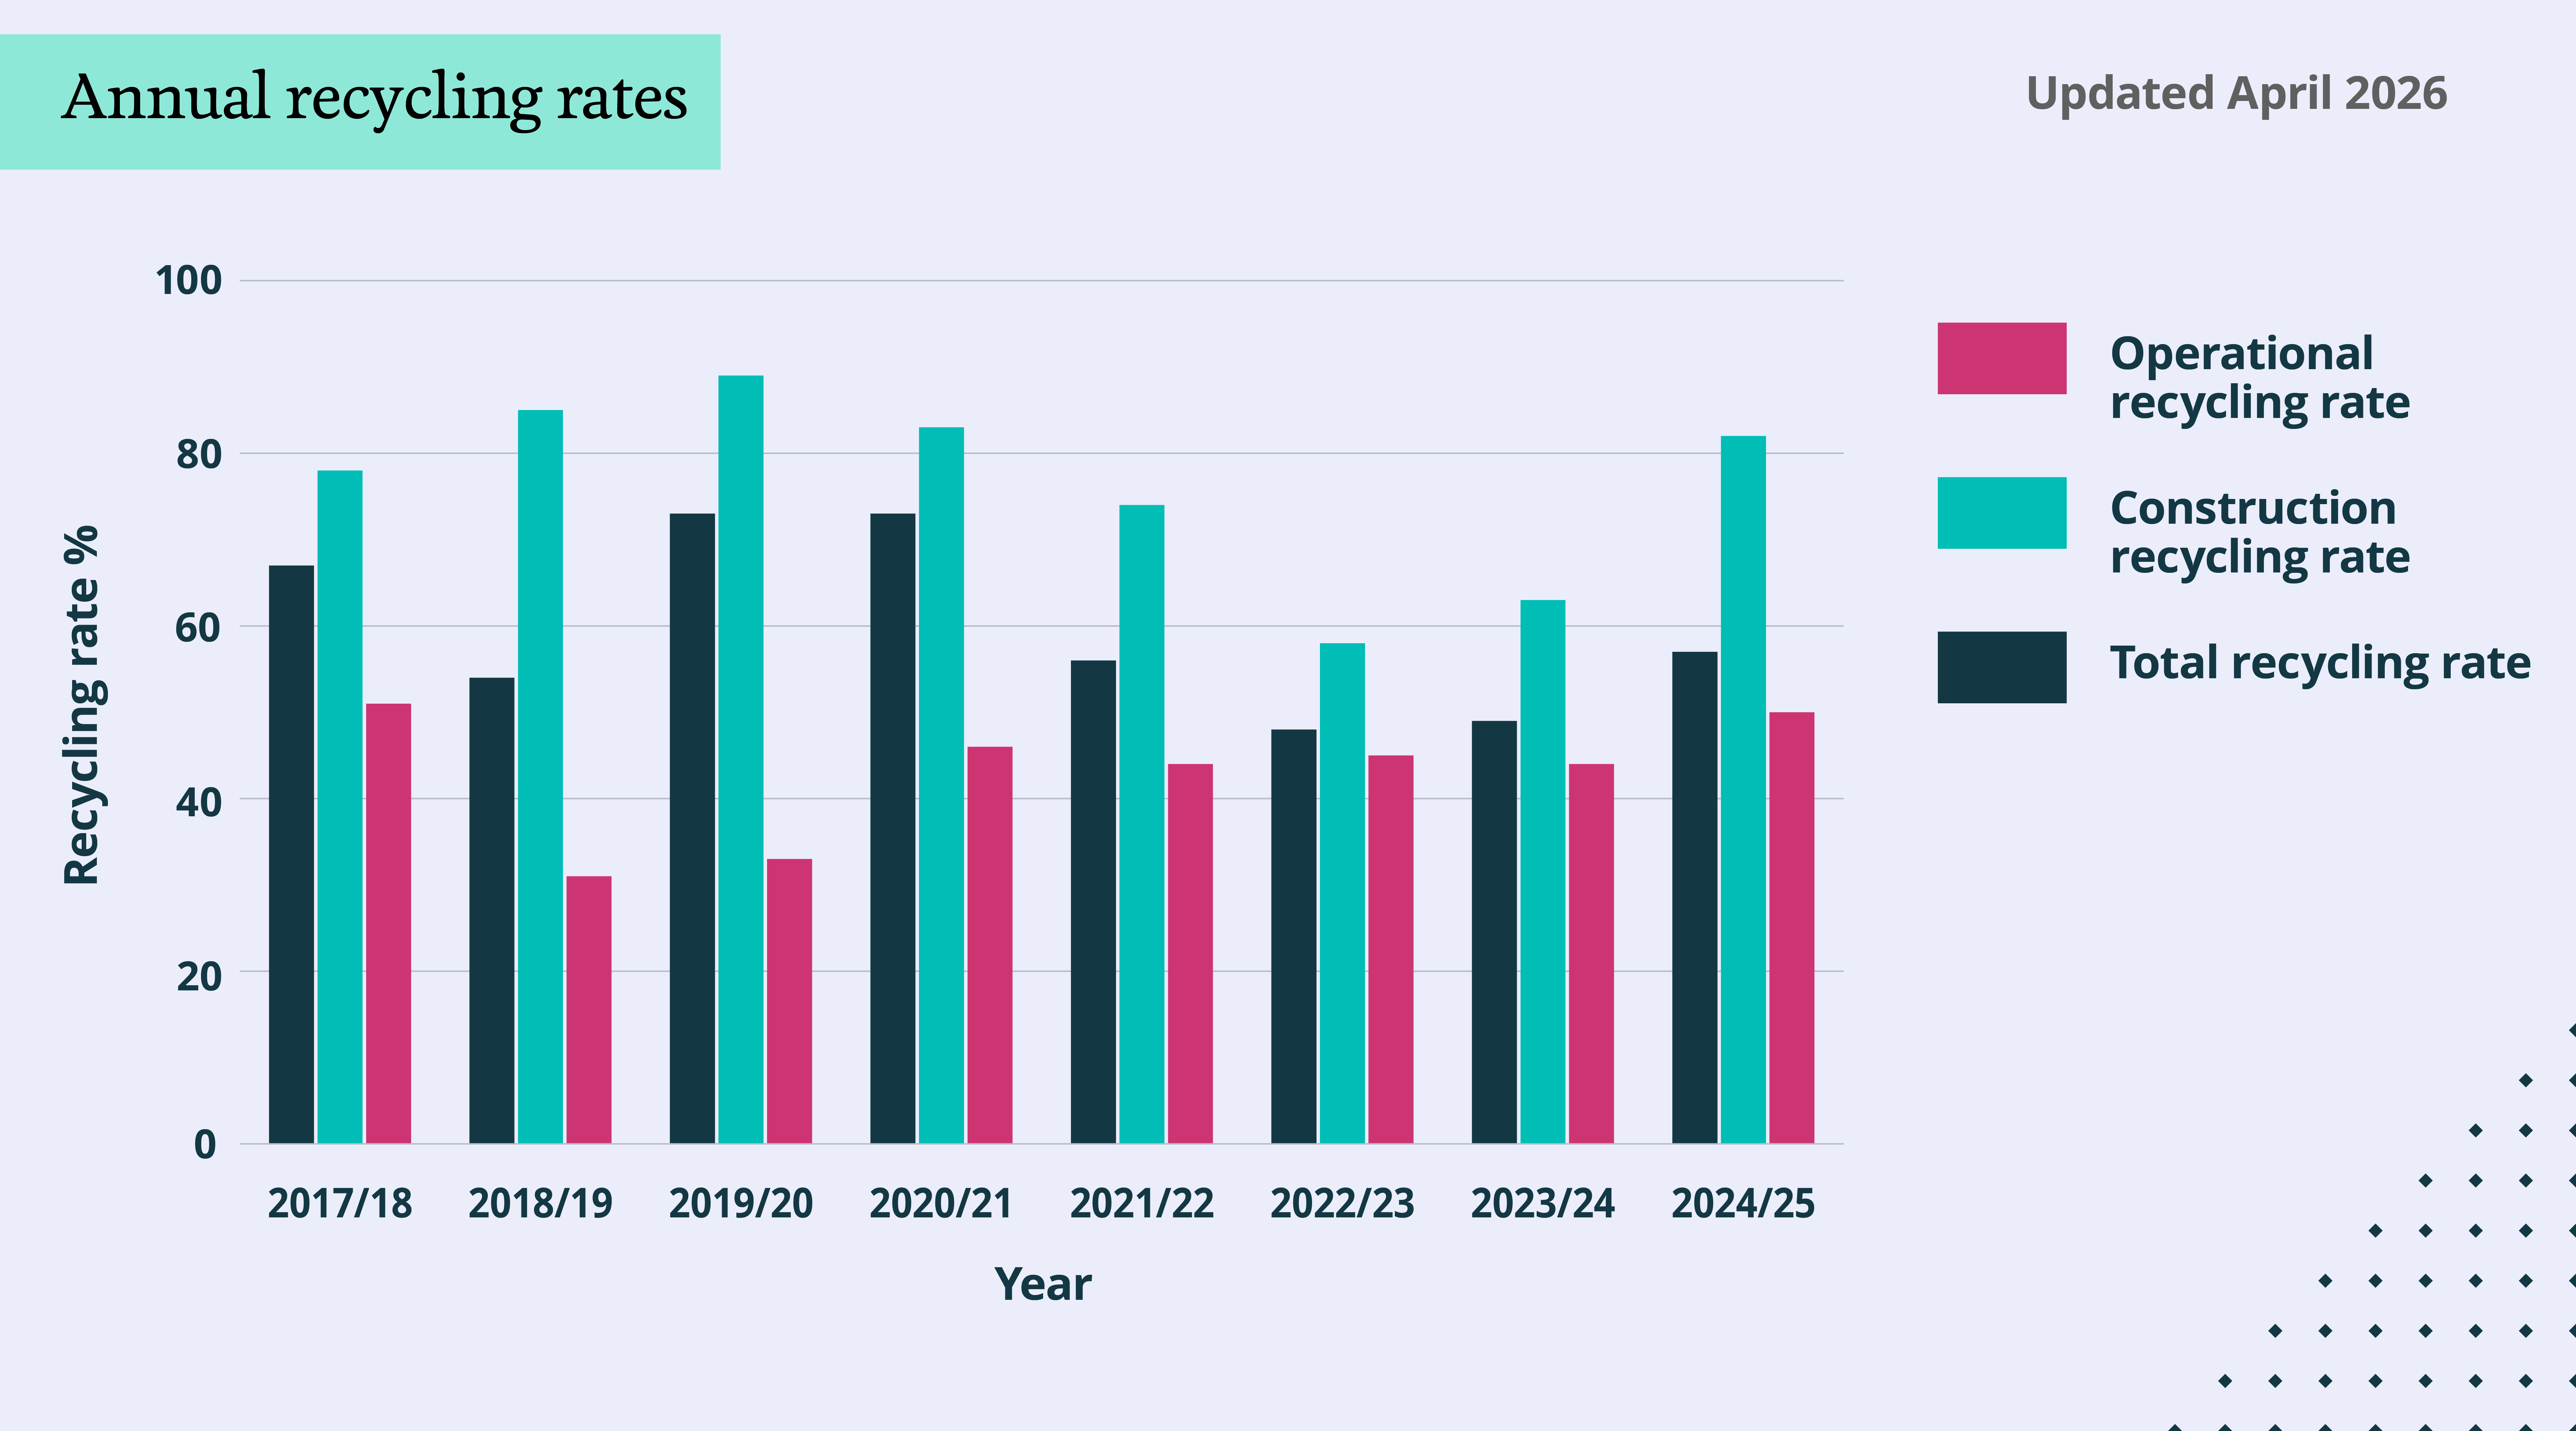
Annual recycling rates
The following graph provides the annual recycling rates (%) of the University's operational estate from operational waste, construction waste and total waste between 2017-18 and 2024-25.
Summary
- The introduction of separate food waste collections has increased operational waste recycling rates to 50% in 2024-25.
- The total recycling rate has increased from 49% in 2023-24 to 57% in 2024-25.
Note
- Hazardous waste has only been included in our recycling rate data since 2022-23.
- Hazardous, clinical or offensive waste often requires incineration, thereby decreasing recycling rates.
- A change to the University's main waste contract in 2022-23 resulted in improvements in data quality, which suggested that previous recycling rates are likely to be over-estimated.
- Recycling also includes composted waste for reporting purposes.
- Recycling figures include waste sent to anaerobic digestion for 2024-25, bringing reporting in line with local authorities.
- In 2023-24, waste collections by one supplier accounted for approximately 19% of total waste collected. This supplier reported composted waste as energy-from-waste, rather than as recycled waste, meaning this proportion of our waste is not included in the total recycling rate shown for 2023-24.
Additional and historic data
Additional and historic data can be found in our Previous annual reporting and in the University of Cambridge Annual Reports and Financial Statements.
For our commitments and approach, please visit the Waste and circular economy page.