Alt Text:
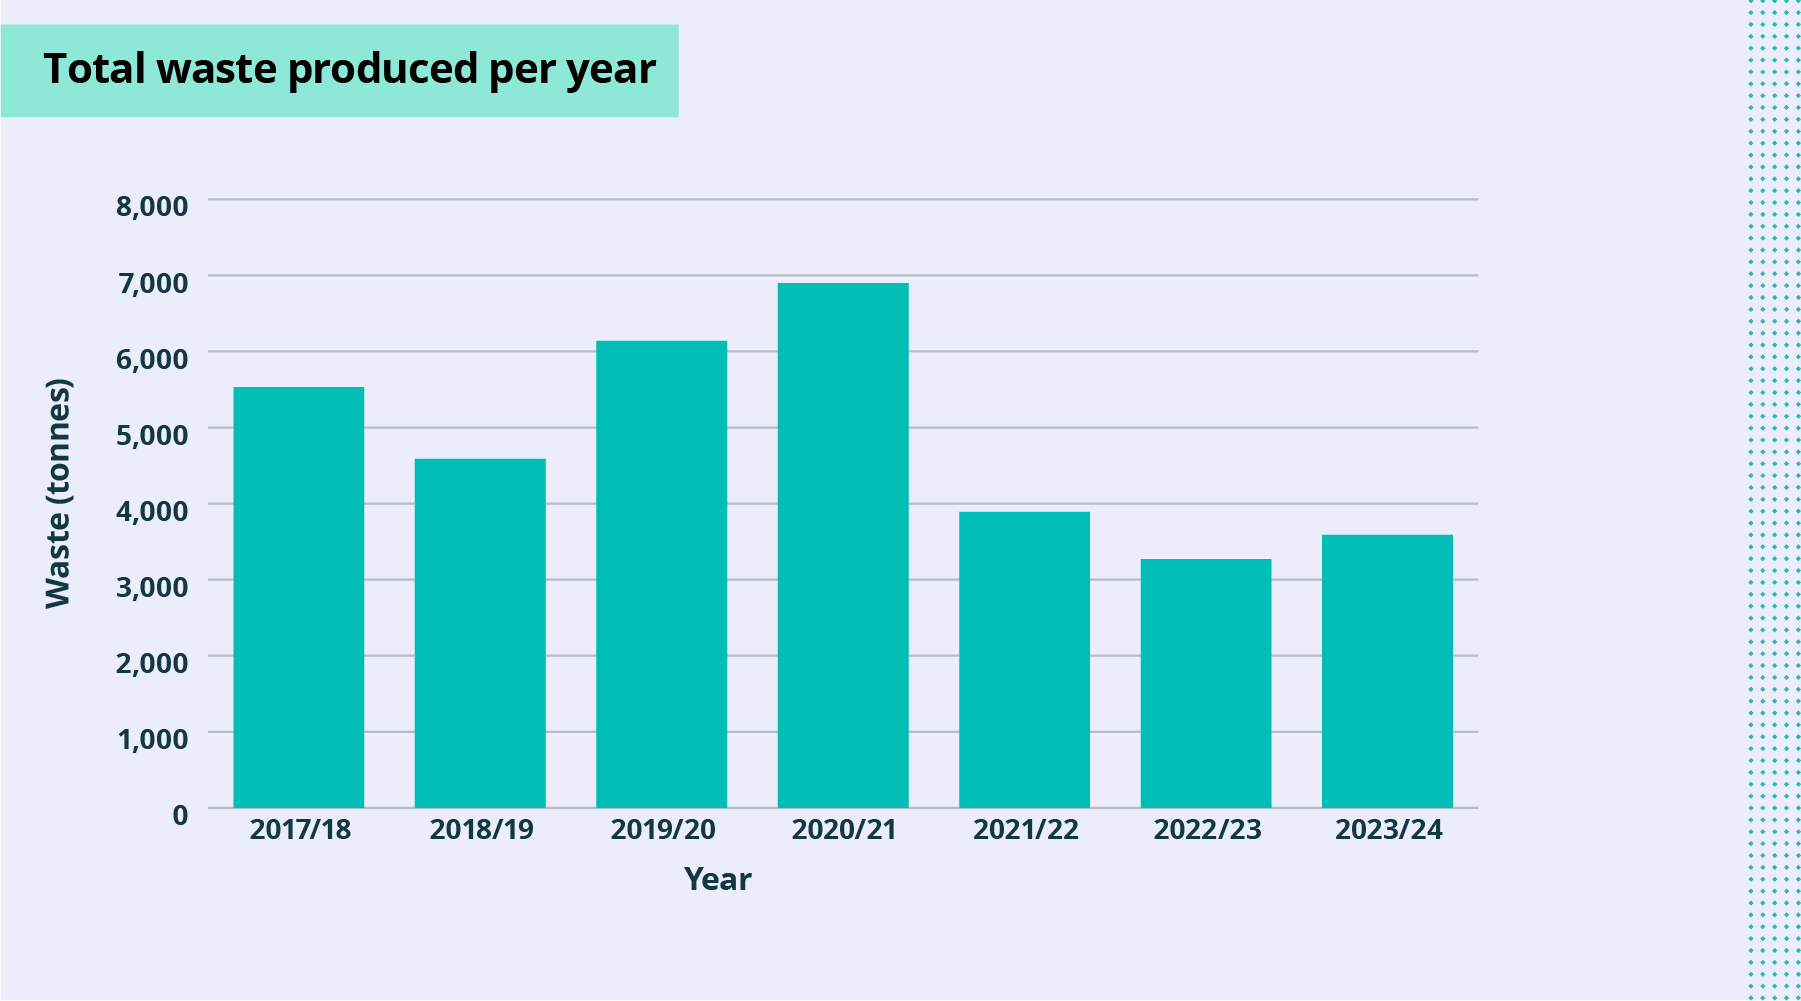
Bar chart showing total waste (tonnes) per year. Level climbed from 5,500 in 2017-18 to almost 7,000 in 2020-21. Dropped to almost 4,000 in 2021-22 and remains around 3,500 in 2023-24.
Environmental Sustainability
© 2025 University of Cambridge