
Carbon and energy progress
Scope 1 and scope 2 annual carbon emissions
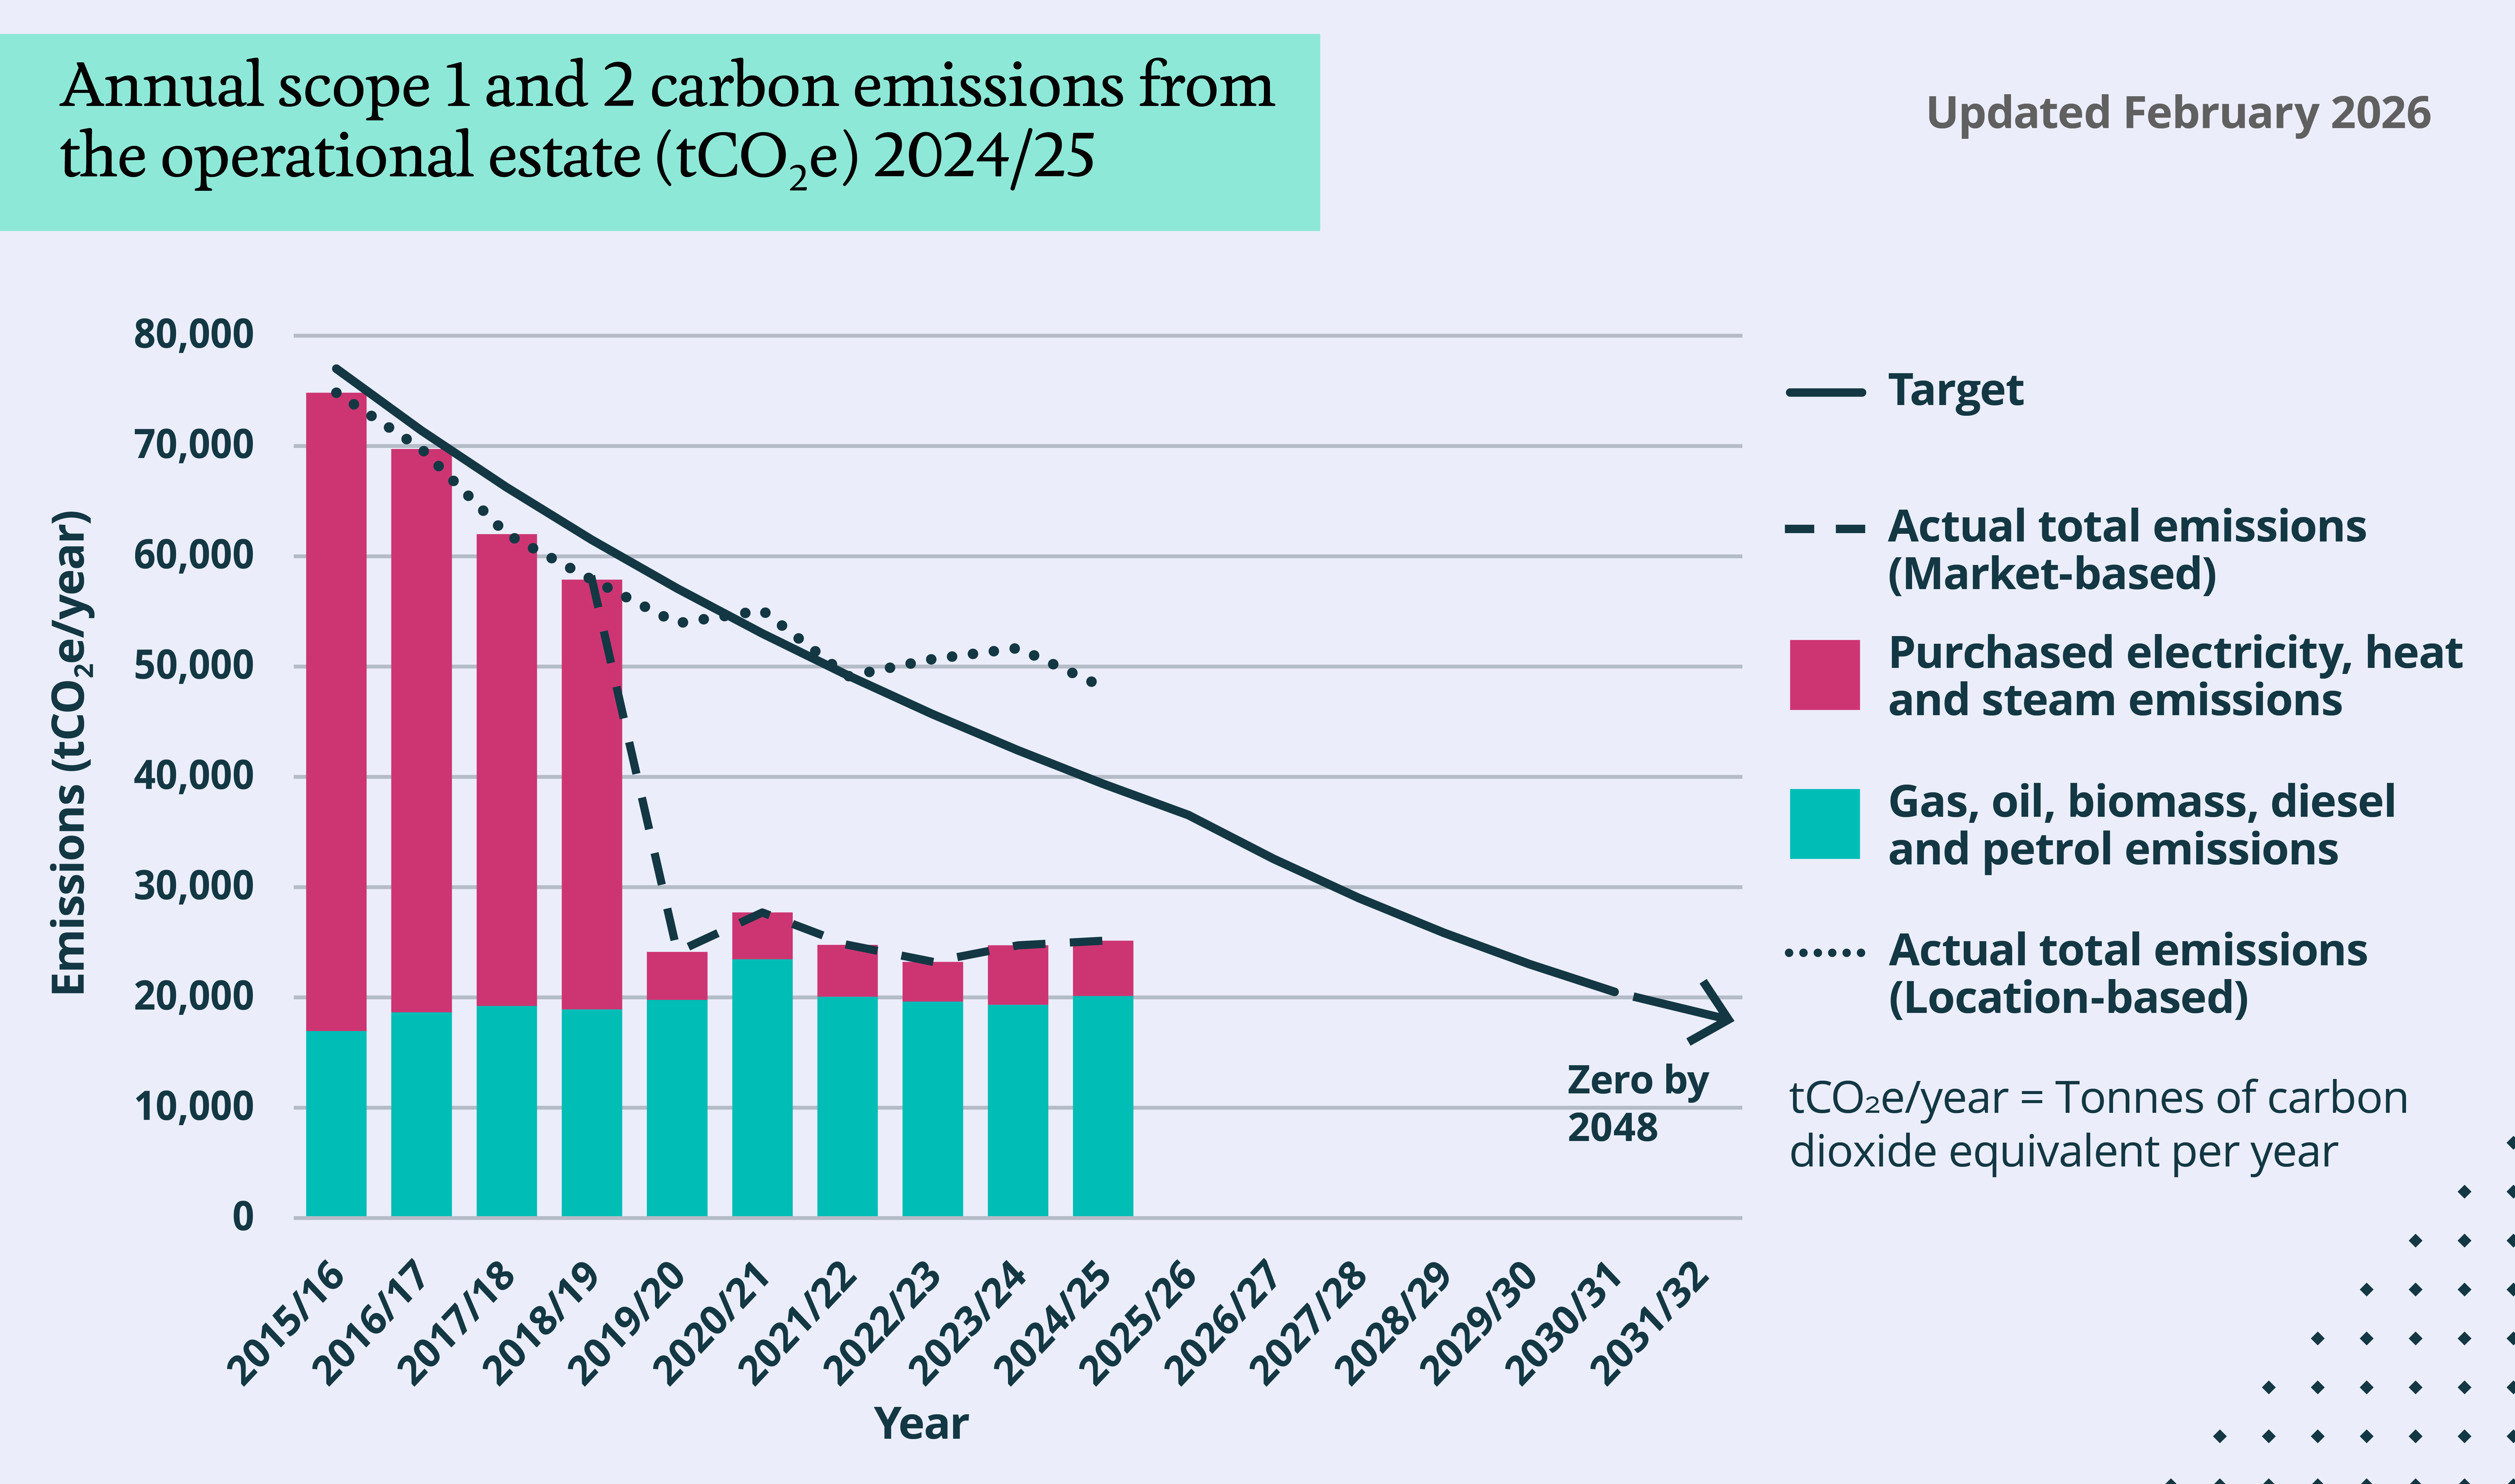
The following graph shows our carbon emissions from the operational estate for 2024-25 against our scope 1 and scope 2 carbon reduction target.
Actual emissions are broken down into emissions from gas, oil, biomass, diesel and petrol used on our estate (scope 1 emissions) and emissions from purchased electricity, heat and steam (scope 2 emissions).
Progress against our carbon reduction target is monitored against the "Market-based" emissions figures, calculated since 2019. For transparency, "Location-based" emissions figures are also shown.
Market-based emissions figures reflect the amount of energy we used and the carbon intensity of the University's chosen electricity supplies. Carbon intensity is the measure of the amount of greenhouse gases that are emitted, per kilowatt-hour of electricity generated.
Location-based figures indicate what our emissions would be if all our electricity was sourced from suppliers that have the same carbon intensity as the UK power grid's average emissions intensity.
Note: We have an Independent Limited Assurance Report by PwC for our scope 1 and scope 2 carbon emissions data.
Summary
- We remain on track with our carbon reduction target.
- Emissions from gas were 4% higher in 2024-25 against 2023-24 levels.
- Market-based emissions have reduced by 66% since 2015-16 and remain dominated by scope 1 emissions, particularly emissions from natural gas.
- Market-based emissions increased by 1.7% in 2024-25 against 2023-24 levels. This has been driven by an increase in scope 1 emissions associated with an increase in the University gas demand, prompted by a cooler winter period.
- Location-based emissions decreased in 2024-25 against 2023-24 levels. This is primarily due to further decarbonisation of the national electricity grid.
Scope 1, scope 2 and scope 3 emissions breakdown
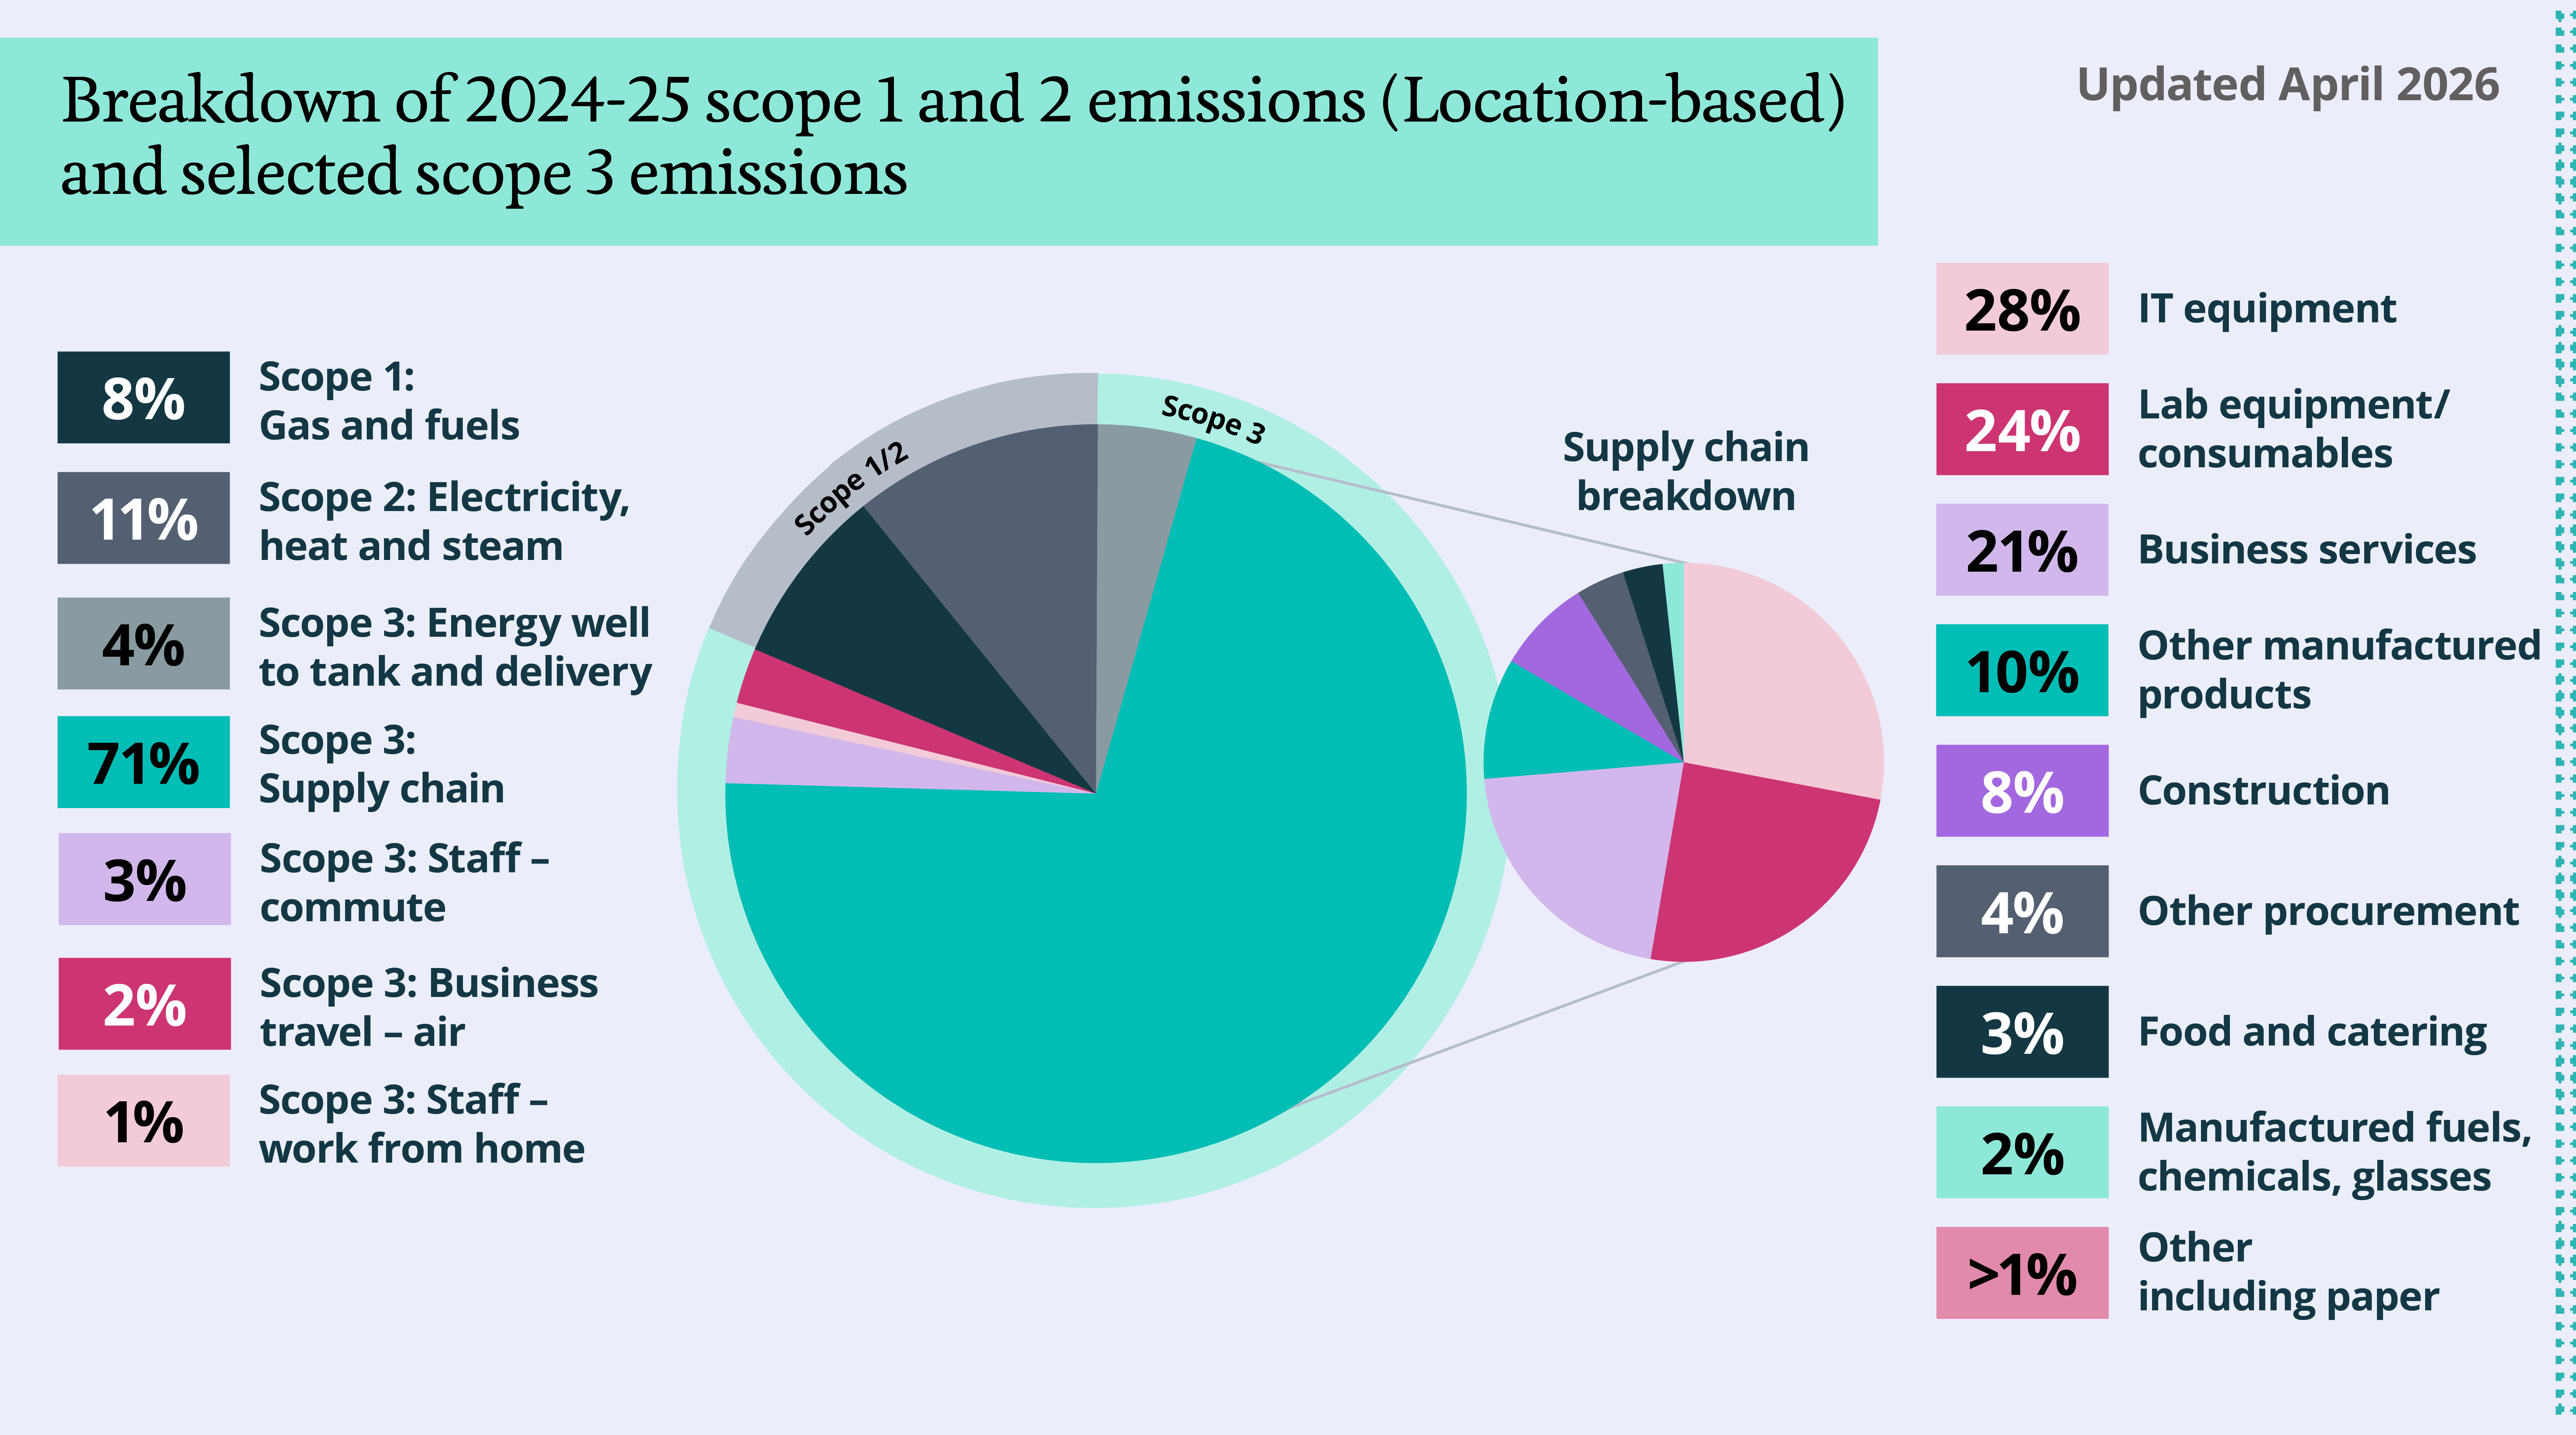
The following graph provides a breakdown of the University's location-based carbon emissions across scope 1 and scope 2 emissions from the operational estate, and selected scope 3 emission categories.
Scope 3 emissions are calculated using carbon emission factors published by the UK Government and the Higher Education Supply Chain Emissions Tool (HESCET). The selected scope 3 emissions are from the University's supply chain and associated transportation, business travel emissions (primarily from air travel), staff commuting, and emissions associated with staff working from home. These are the most significant categories for the University's scope 3 emissions, as determined by our scope 3 screening assessment, and are also the categories where we hold sufficient data for meaningful emissions calculations. The categories not included in this graph are waste, water, emissions from downstream leased assets, and all types of student travel. In future, we hope to calculate and include these emissions sources in our environmental reporting.
Scope 3 emissions from investments are also not included in this graph as emissions from the University's Endowment Fund are reported separately by University of Cambridge Investment Management.
Note: Emissions from capital goods (including building and refurbishment) and upstream transportation and distribution emissions have been included within our purchased goods and services emission calculations.
Summary
- 81% of our total reported emissions (using location-based scope 1 and 2) come from scope 3 emissions.
- 71% of these total scope 3 emissions are attributed to supply chain-related activities.
- Our supply chain emissions are dominated by three categories covering IT equipment, lab equipment and consumables and business services. These account for 76% of our total reported emissions across all scopes.
- Business travel accounts for 3% of total reported emissions across all three scopes. Of that, air travel accounts for 92% of business travel emissions.
- Staff commuting emissions should be considered alongside staff working from home emissions. If more staff work from home, staff commuting figures may go down, and vice versa.
- Scope 3 emissions from investments are also not included in this graph but emissions from the University's Endowment Fund are reported separately by University of Cambridge Investment Management.
Data Assurance Methodology Statement
View our Environmental Sustainability Data Assurance Methodology Statement 2024-25 on the University of Cambridge's environmental sustainability Scope 1 and Scope 2 data, independently assured by PricewaterhouseCoopers (PwC). You can also view our most recent accompanying Independent Limited Assurance Report by PwC.
Additional and historic data
Additional and historic data can be found in our Previous annual reporting and in the University of Cambridge Annual Reports and Financial Statements.
For our commitments and approach, please visit the Carbon and energy page.