Scope 1 and scope 2 annual carbon emissions
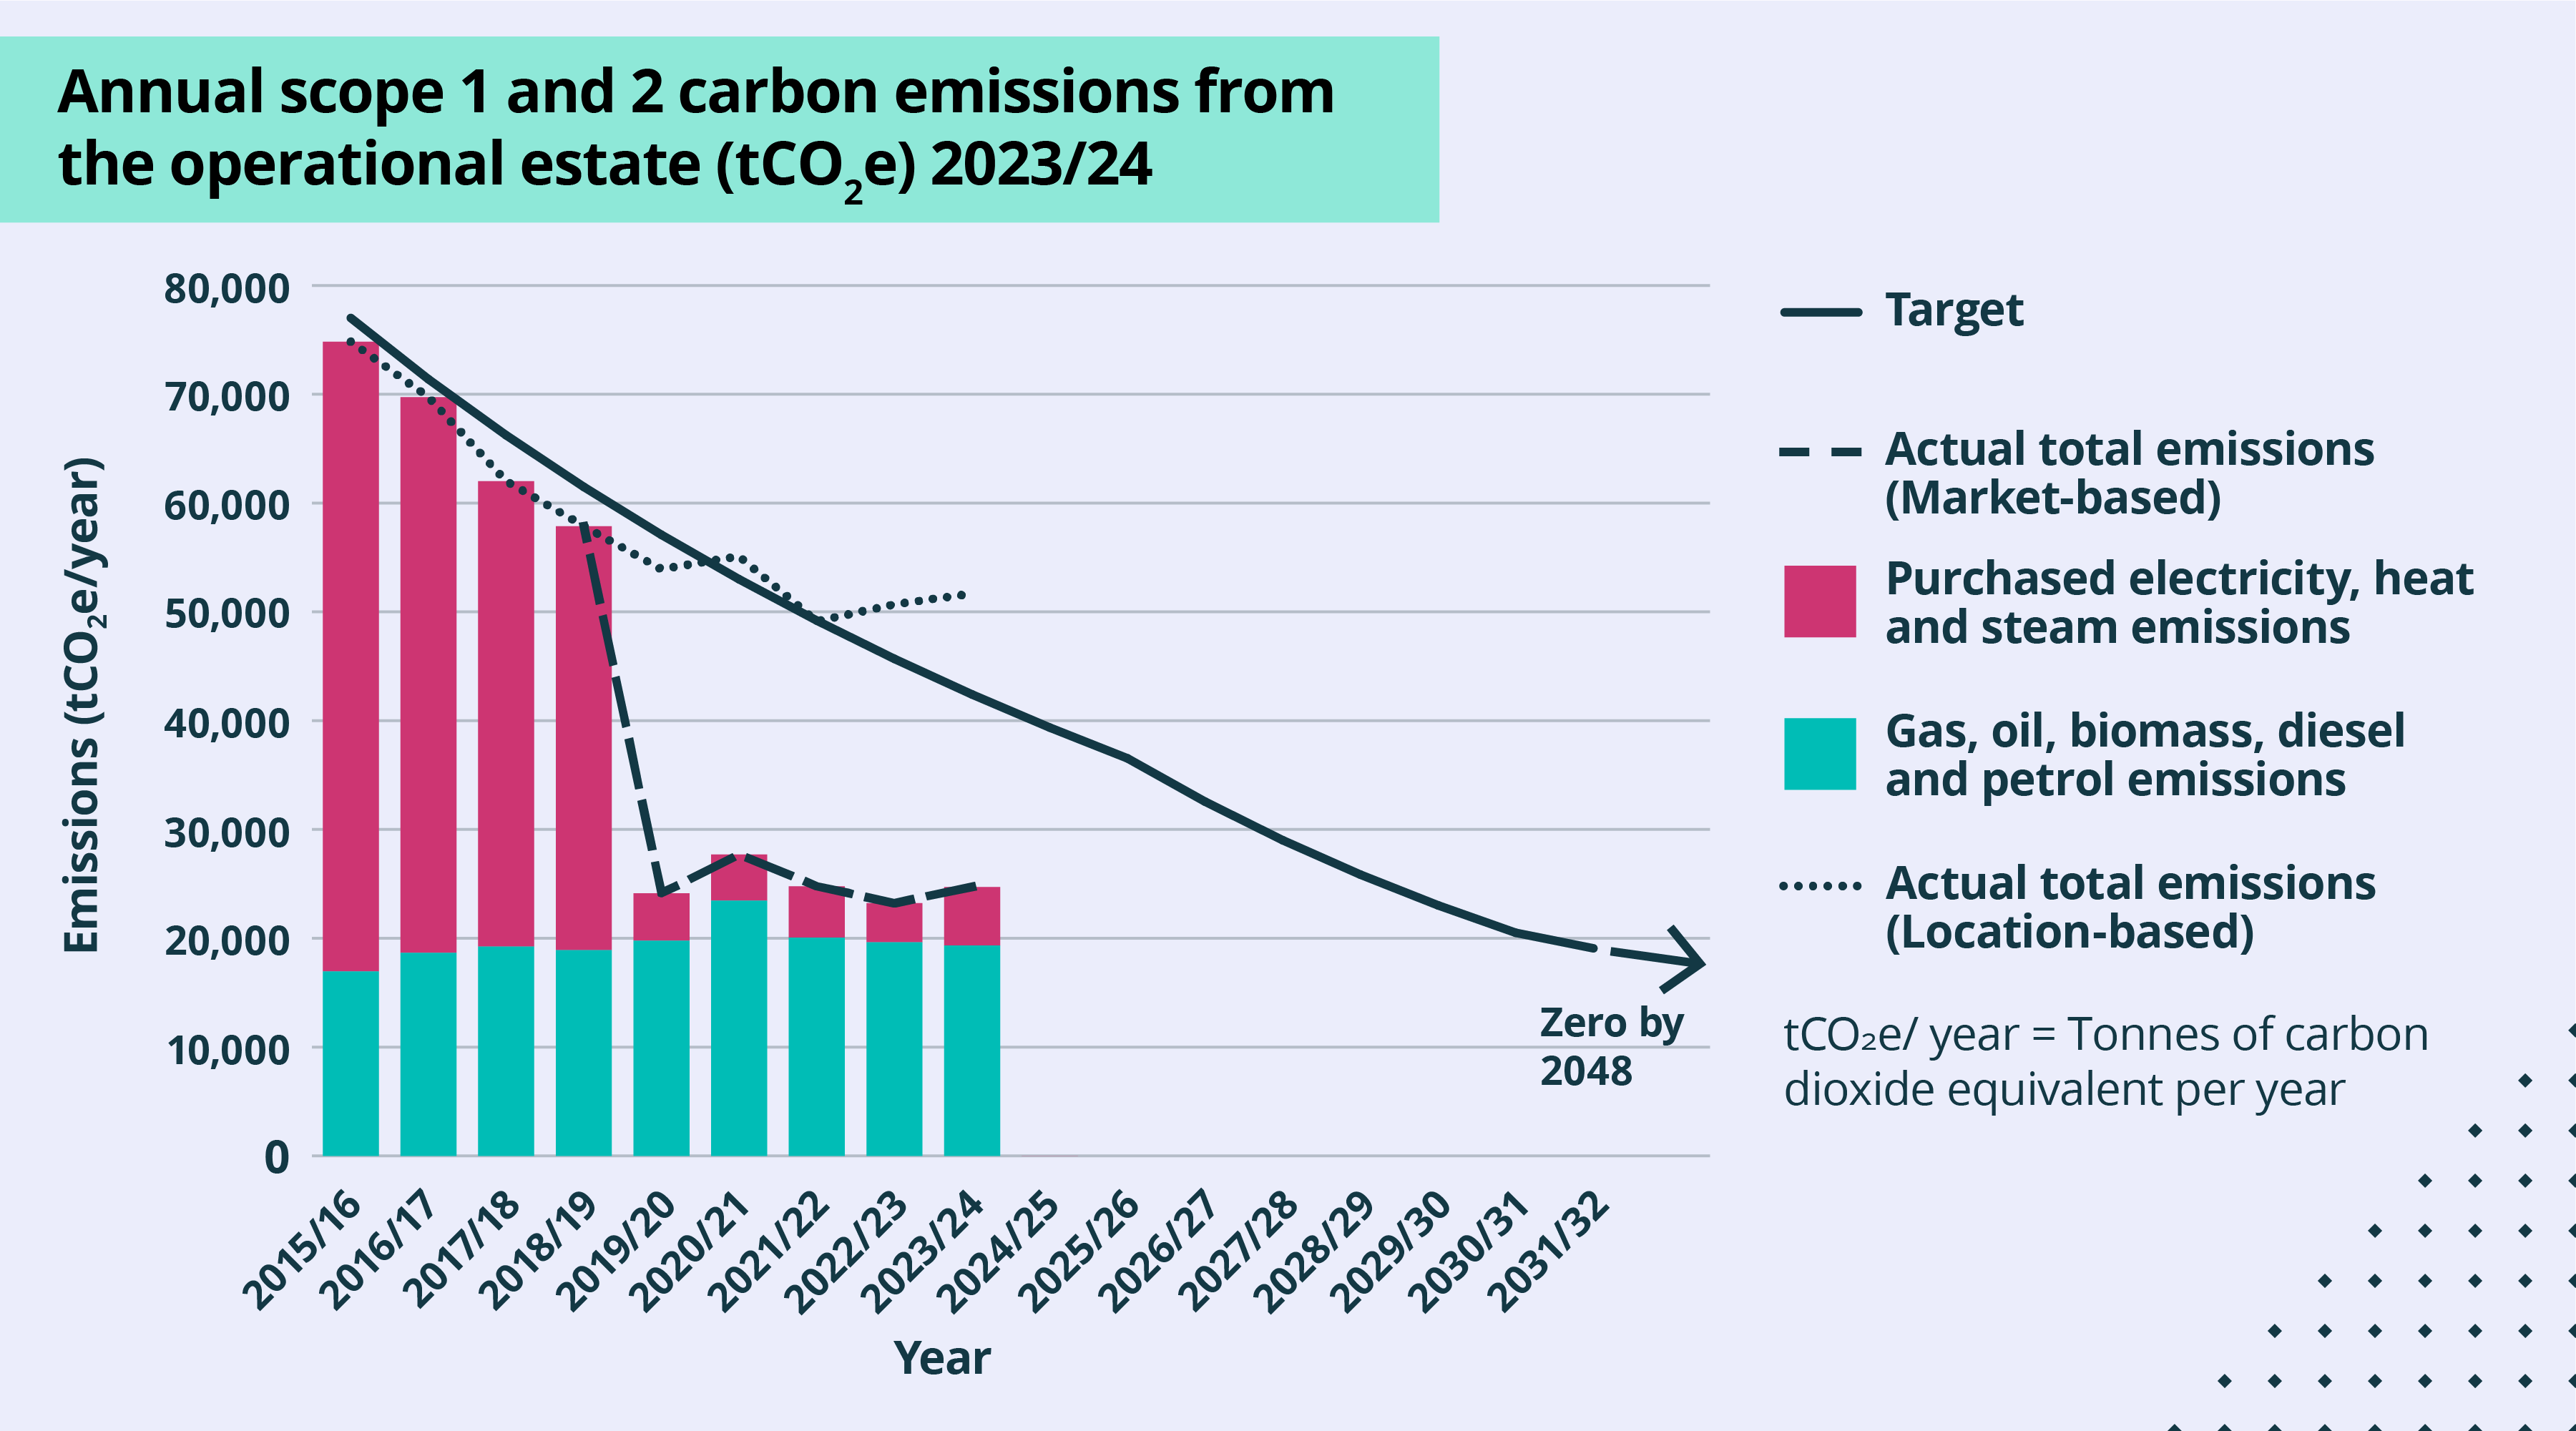
The following graph shows our carbon emissions from the operational estate for 2023-24 against our scope 1 and scope 2 carbon reduction commitment.
Actual emissions are broken down into emissions from gas, oil, biomass, diesel and petrol used on our estate (scope 1 emissions) and emissions from purchased electricity, heat and steam (scope 2 emissions).
Progress against our carbon reduction commitment is monitored against the "market-based" emissions figures calculated since 2019. For transparency, "location-based" emissions figures are also shown.
Market-based emissions figures reflect the amount of energy we used and their carbon intensity from our electricity suppliers. Carbon intensity is the measure of how much CO2 and CO2 equivalent of other greenhouse gases are emitted, per kilowatt-hour of electricity generated.
Location-based figures indicate what our emissions would be if all our electricity was sourced from suppliers that have the same carbon intensity as the UK power grid's average emissions intensity.
Summary
- We remain on track with our carbon reduction target.
- Emissions from gas were 2% lower in 2023-24 against 2022-23 levels.
- Market-based emissions have reduced by 67% since 2015-16 and remain dominated by scope 1 emissions, particularly emissions from natural gas.
- Market-based emissions increased by 6% in 2023-24 against 2022-23 levels. This is mainly due to a change in how emissions from heat and steam are calculated. The carbon conversion factor was amended to more accurately reflect the carbon intensity of heat and steam use.
- Location-based emissions also increased in 2023-24 against 2022-23 levels. This is because electricity use on the main University estate increased by 2.5%, excluding the Cambridge Biomedical Campus. As our electricity is procured from zero-carbon sources this increase in consumption did not affect our market-based emissions figures.
- The carbon intensity of the electricity used by the University at the Cambridge Biomedical Campus (energy supplier EDF Energy) increased by 60%. This is due to a change in the fuel mix used by the supplier in 2023-24.
Scope 1, scope 2 and scope 3 emissions breakdown
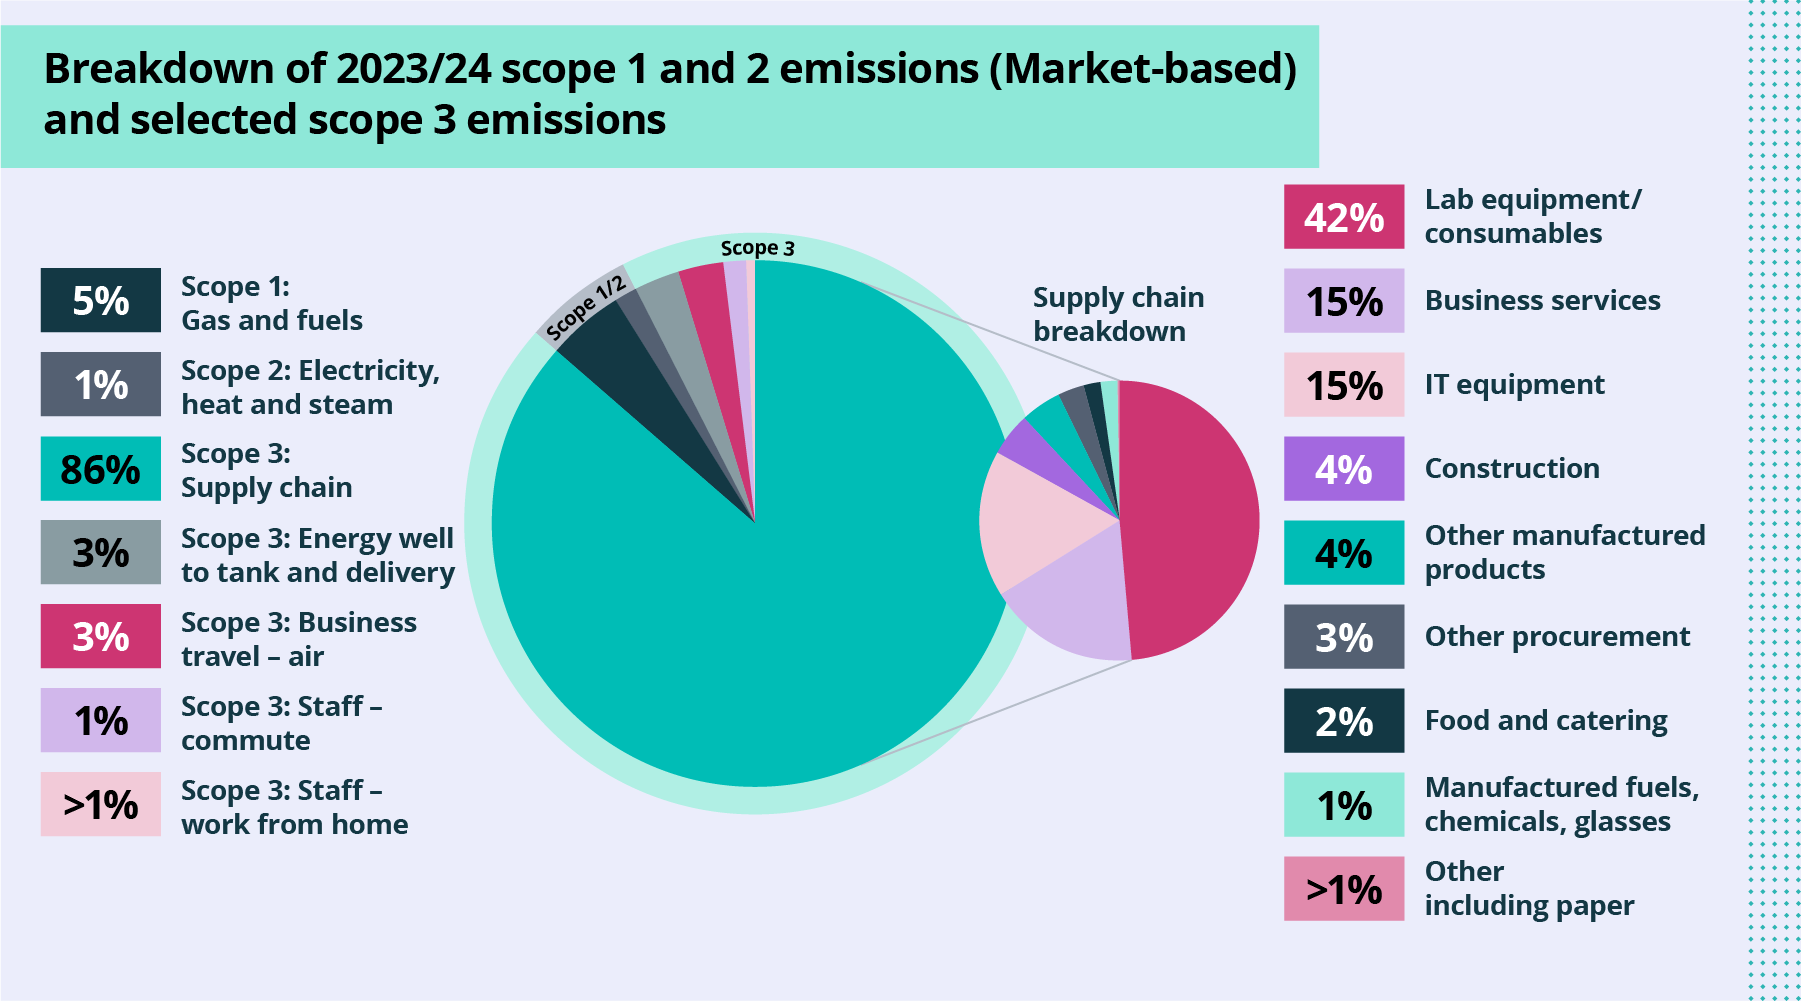
The following graph provides a breakdown of the University's market-based carbon emissions across scope 1 and scope 2 emissions from the operational estate, and selected scope 3 emissions categories.
Scope 3 emissions are calculated using carbon emissions factors published by the UK Government and the Higher Education Supply Chain Emissions Tool (HESCET). The selected scope 3 emissions are from the University's supply chain and associated transportation, business travel emissions (primarily from air travel), staff commuting, and for the first time, emissions associated with staff working from home. These are the most significant categories for the University's scope 3 emissions, as determined by our scope 3 screening assessment, and are also the categories where we hold sufficient data for meaningful emissions calculations. The categories not included in this graph are waste, water, emissions from downstream leased assets, and all types of student travel. In future, we hope to calculate and include these emissions sources in our environmental reporting.
Scope 3 emissions from investments are also not included in this graph as emissions from the University's Endowment Fund are reported separately by University of Cambridge Investment Management.
Note: Emissions from capital goods (including building and refurbishment) and upstream transportation and distribution emissions have been included within our purchased goods and services emission calculations in line with the HESA calculation methodology.
Summary
- 94% of our total reported market-based emissions come from scope 3 emissions.
- 86% of these total scope 3 emissions are attributed to supply chain-related activities.
- Our supply chain emissions are dominated by four categories covering lab equipment and consumables, business services, IT equipment and construction. These account for 76% of our total reported market-based emissions across all scopes.
- Business travel accounts for 3% of total reported emissions across all three scopes. Of that, air travel accounts for 96% of business travel emissions.
- Staff commuting emissions should be considered alongside staff working from home emissions. If more staff work from home, staff commuting figures may go down, and vice versa.
Additional and historic data
For our commitments and approach, please visit the Carbon and energy page.
All previous Annual Environmental Sustainability Reports and carbon emissions reports are available up to 2022-23. Our reporting approach changed from the 2023-24 year onwards to Our progress pages to make information more transparent and accessible. Qualitative progress against our commitments can be found within our Case studies. These will both be updated on an ongoing basis as new data and material becomes available.
You can also read about the University's work on environmental sustainability in its Annual Report and Financial Statements. Further operational environmental sustainability information is available on request using sustainability@admin.cam.ac.uk