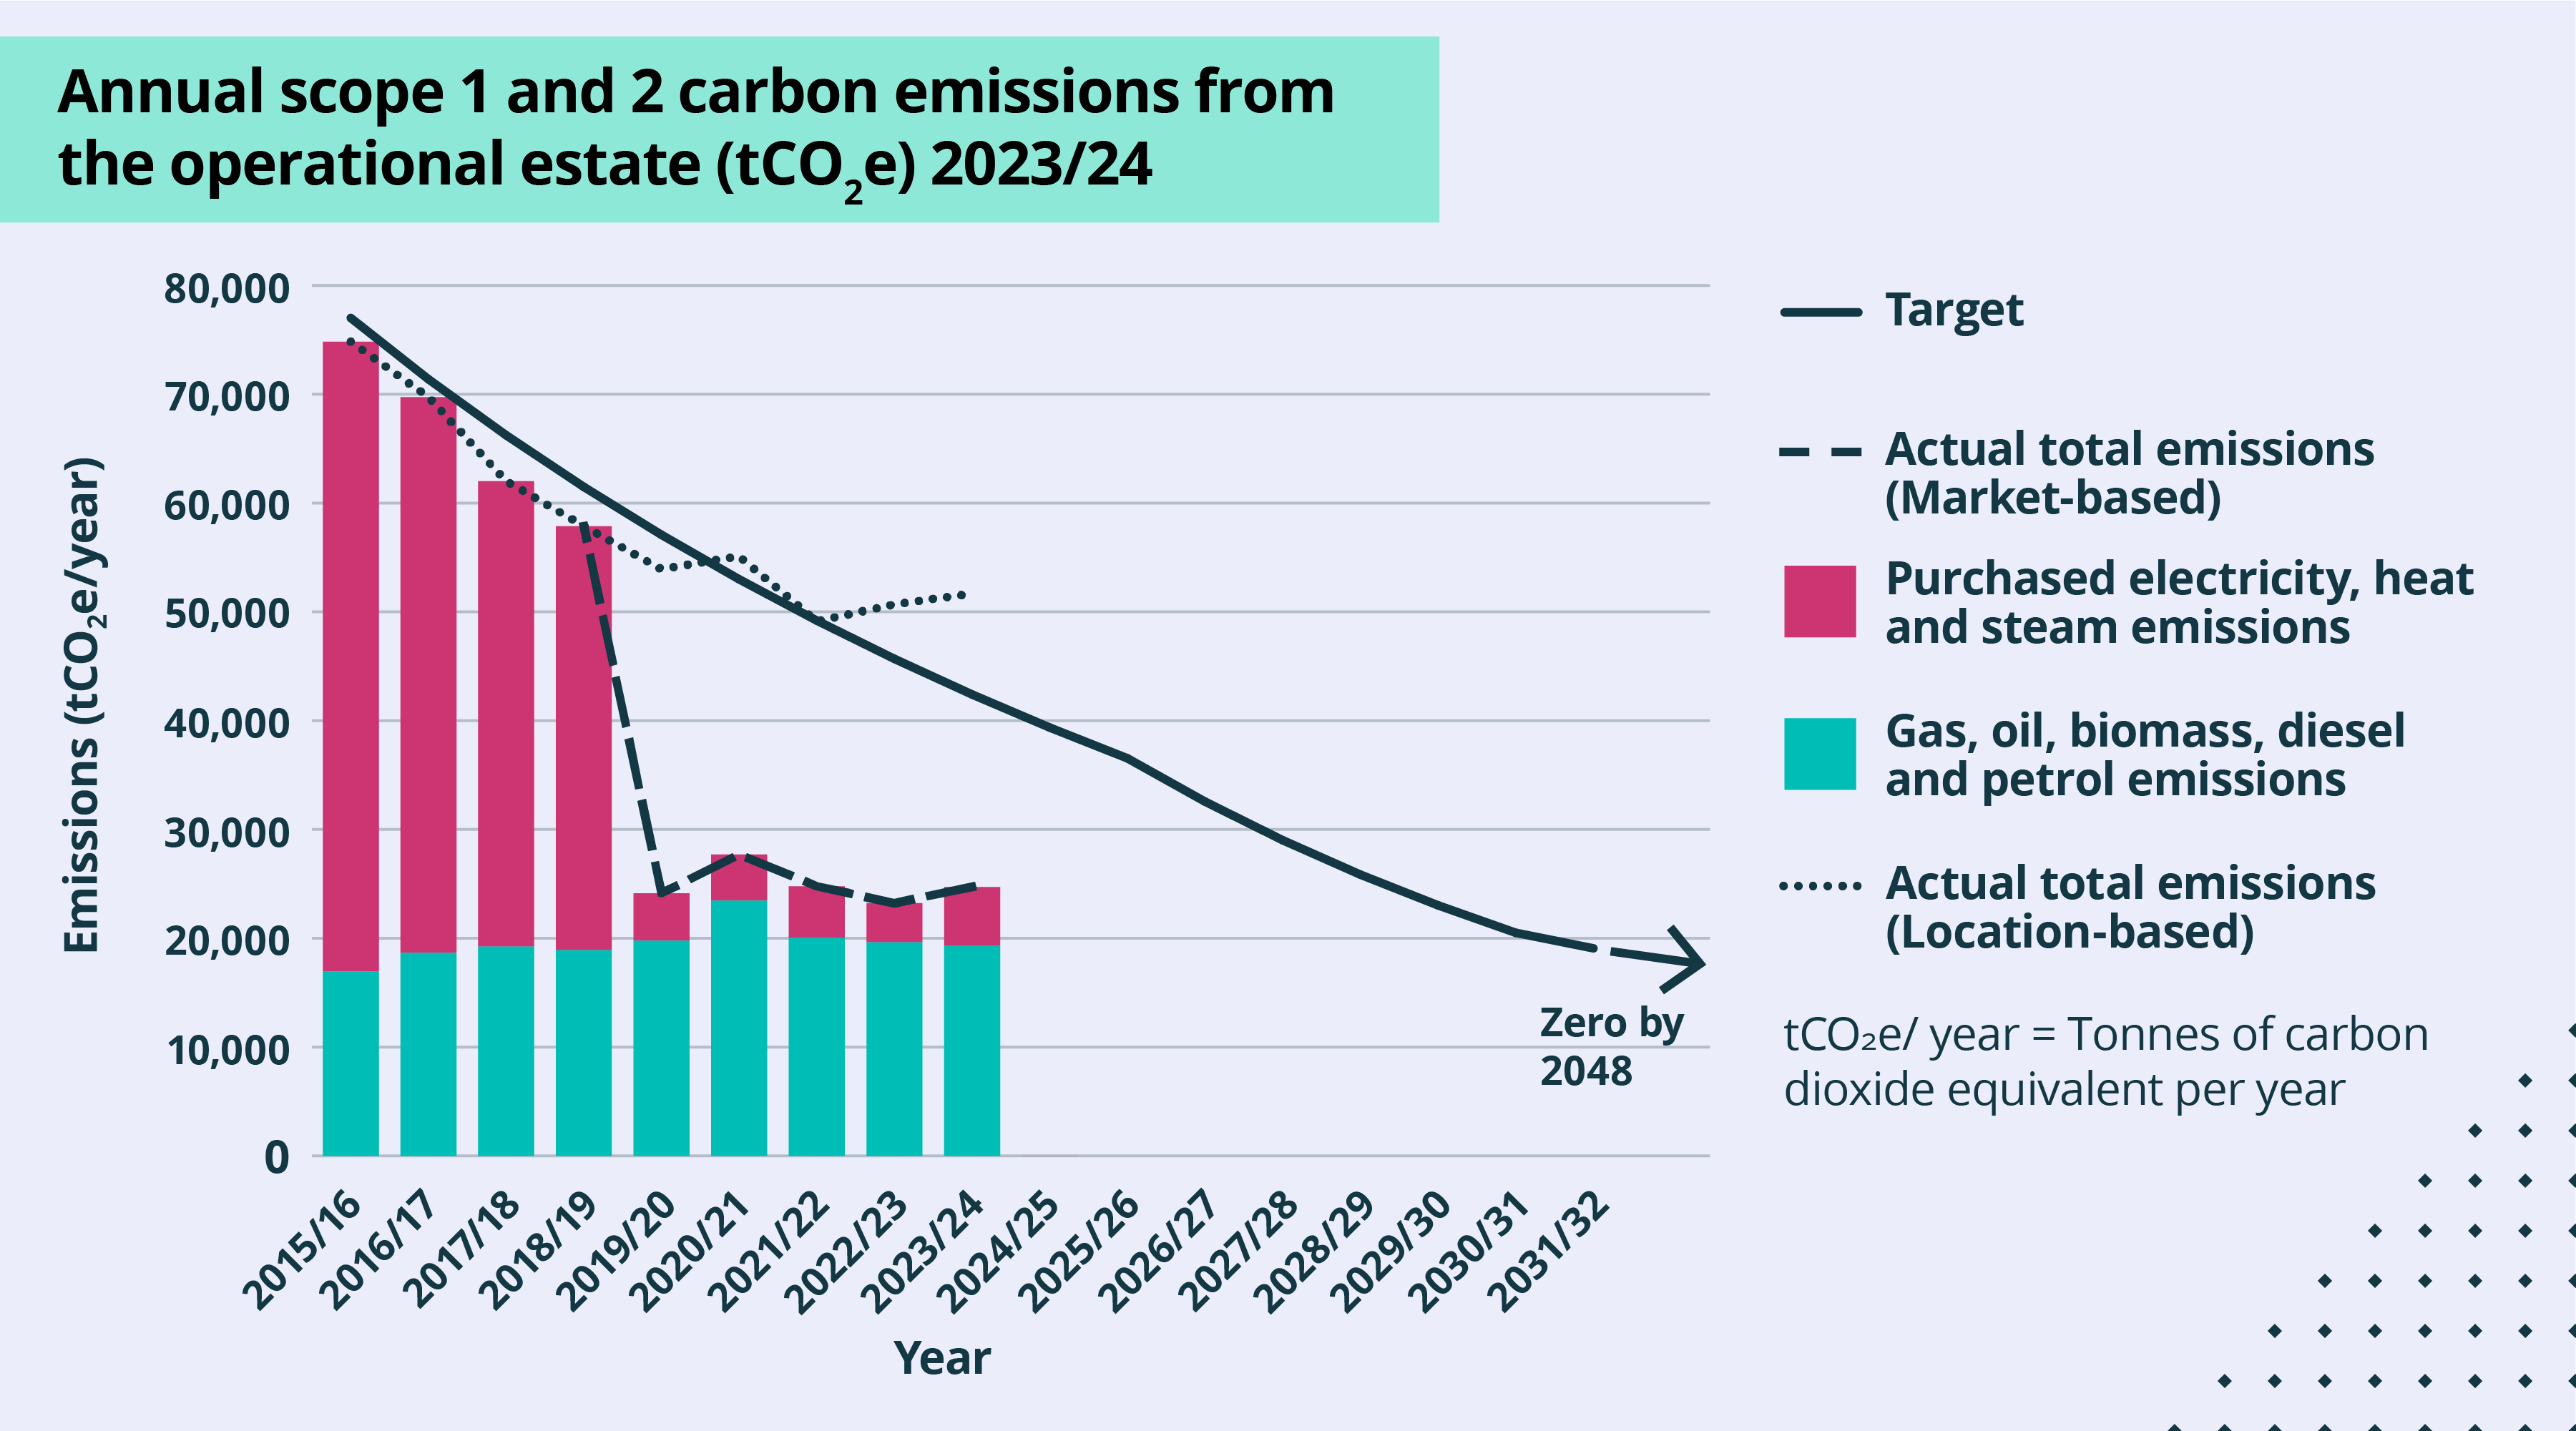
Alt Text:
Bar chart showing annual scope 1 and 2 carbon emissions from operational estate from 2015 to 2024, in tonnes of carbon dioxide equivalent. Graph shows an overall decline in emissions, with a big drop in 2019-20. The target line estimates zero by 2048.