
Water progress
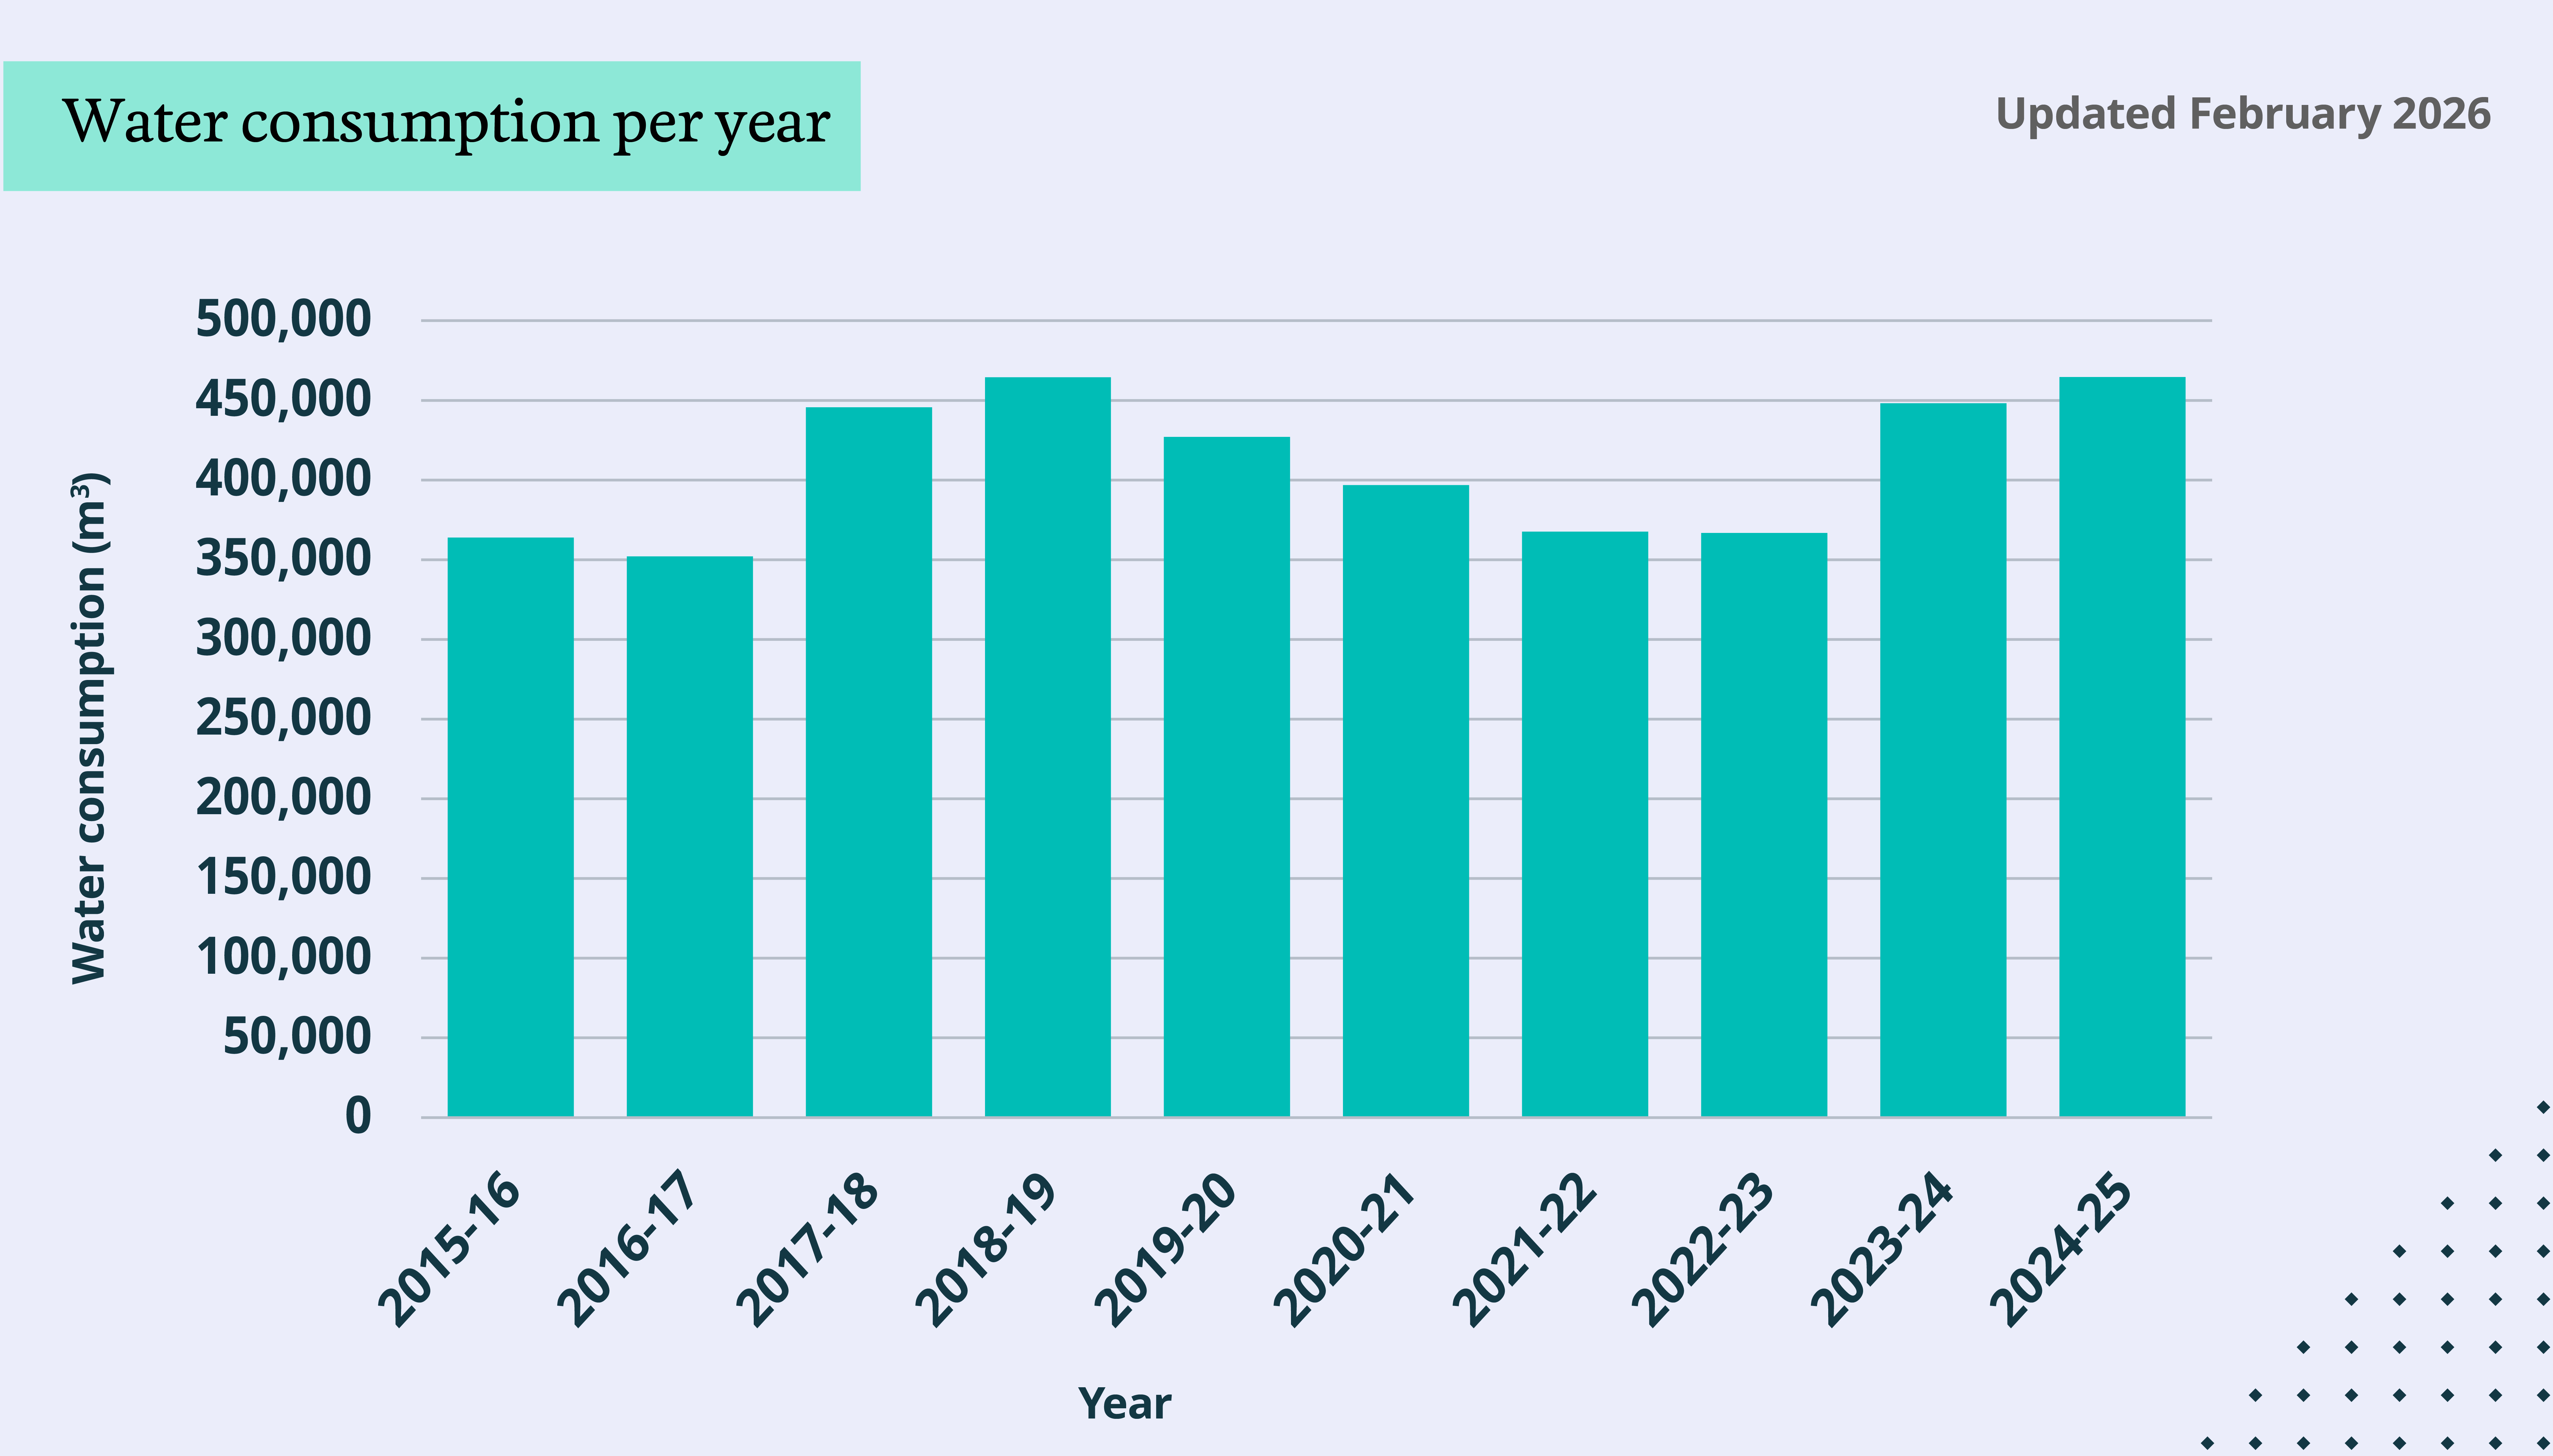
Water consumption per year
The following graph shows total water use on the University's operational estate between 2015-16 and 2024-25 in cubic metres (m³).
Summary
- 2024-25 is in line with previous year's consumption. More accurate data provided by an increase in the number of automated water meter readers across our estate, coupled with proactive action to prevent long term estimated meter readings, largely account for the year-on-year variations in our water consumption figures. We have yet to establish an accurate trend relating to our water use.
Note
- The University began installing automated water meter reading devices onto its largest consuming water meters in 2023 and this rollout continues. This has allowed us to develop a more accurate understanding of our water consumption. Year on year differences in our consumption figures prior to 2023 are a reflection of billing patterns and inconsistent meter reading schedules.
- Also, the University has been receiving synchronous billing (i.e. real-time data) across both its water consumption and wastewater disposal since January 2023. This gives us a more accurate understanding of what we consume. The improved data is providing a baseline against which we will measure the success of future water efficiency initiatives.
Additional and historic data
Additional and historic data can be found in our Previous annual reporting and in the University of Cambridge Annual Reports and Financial Statements.
For our commitments and approach, please visit the Water page.