
Travel and transport progress
The 10 year trend of staff travel modes
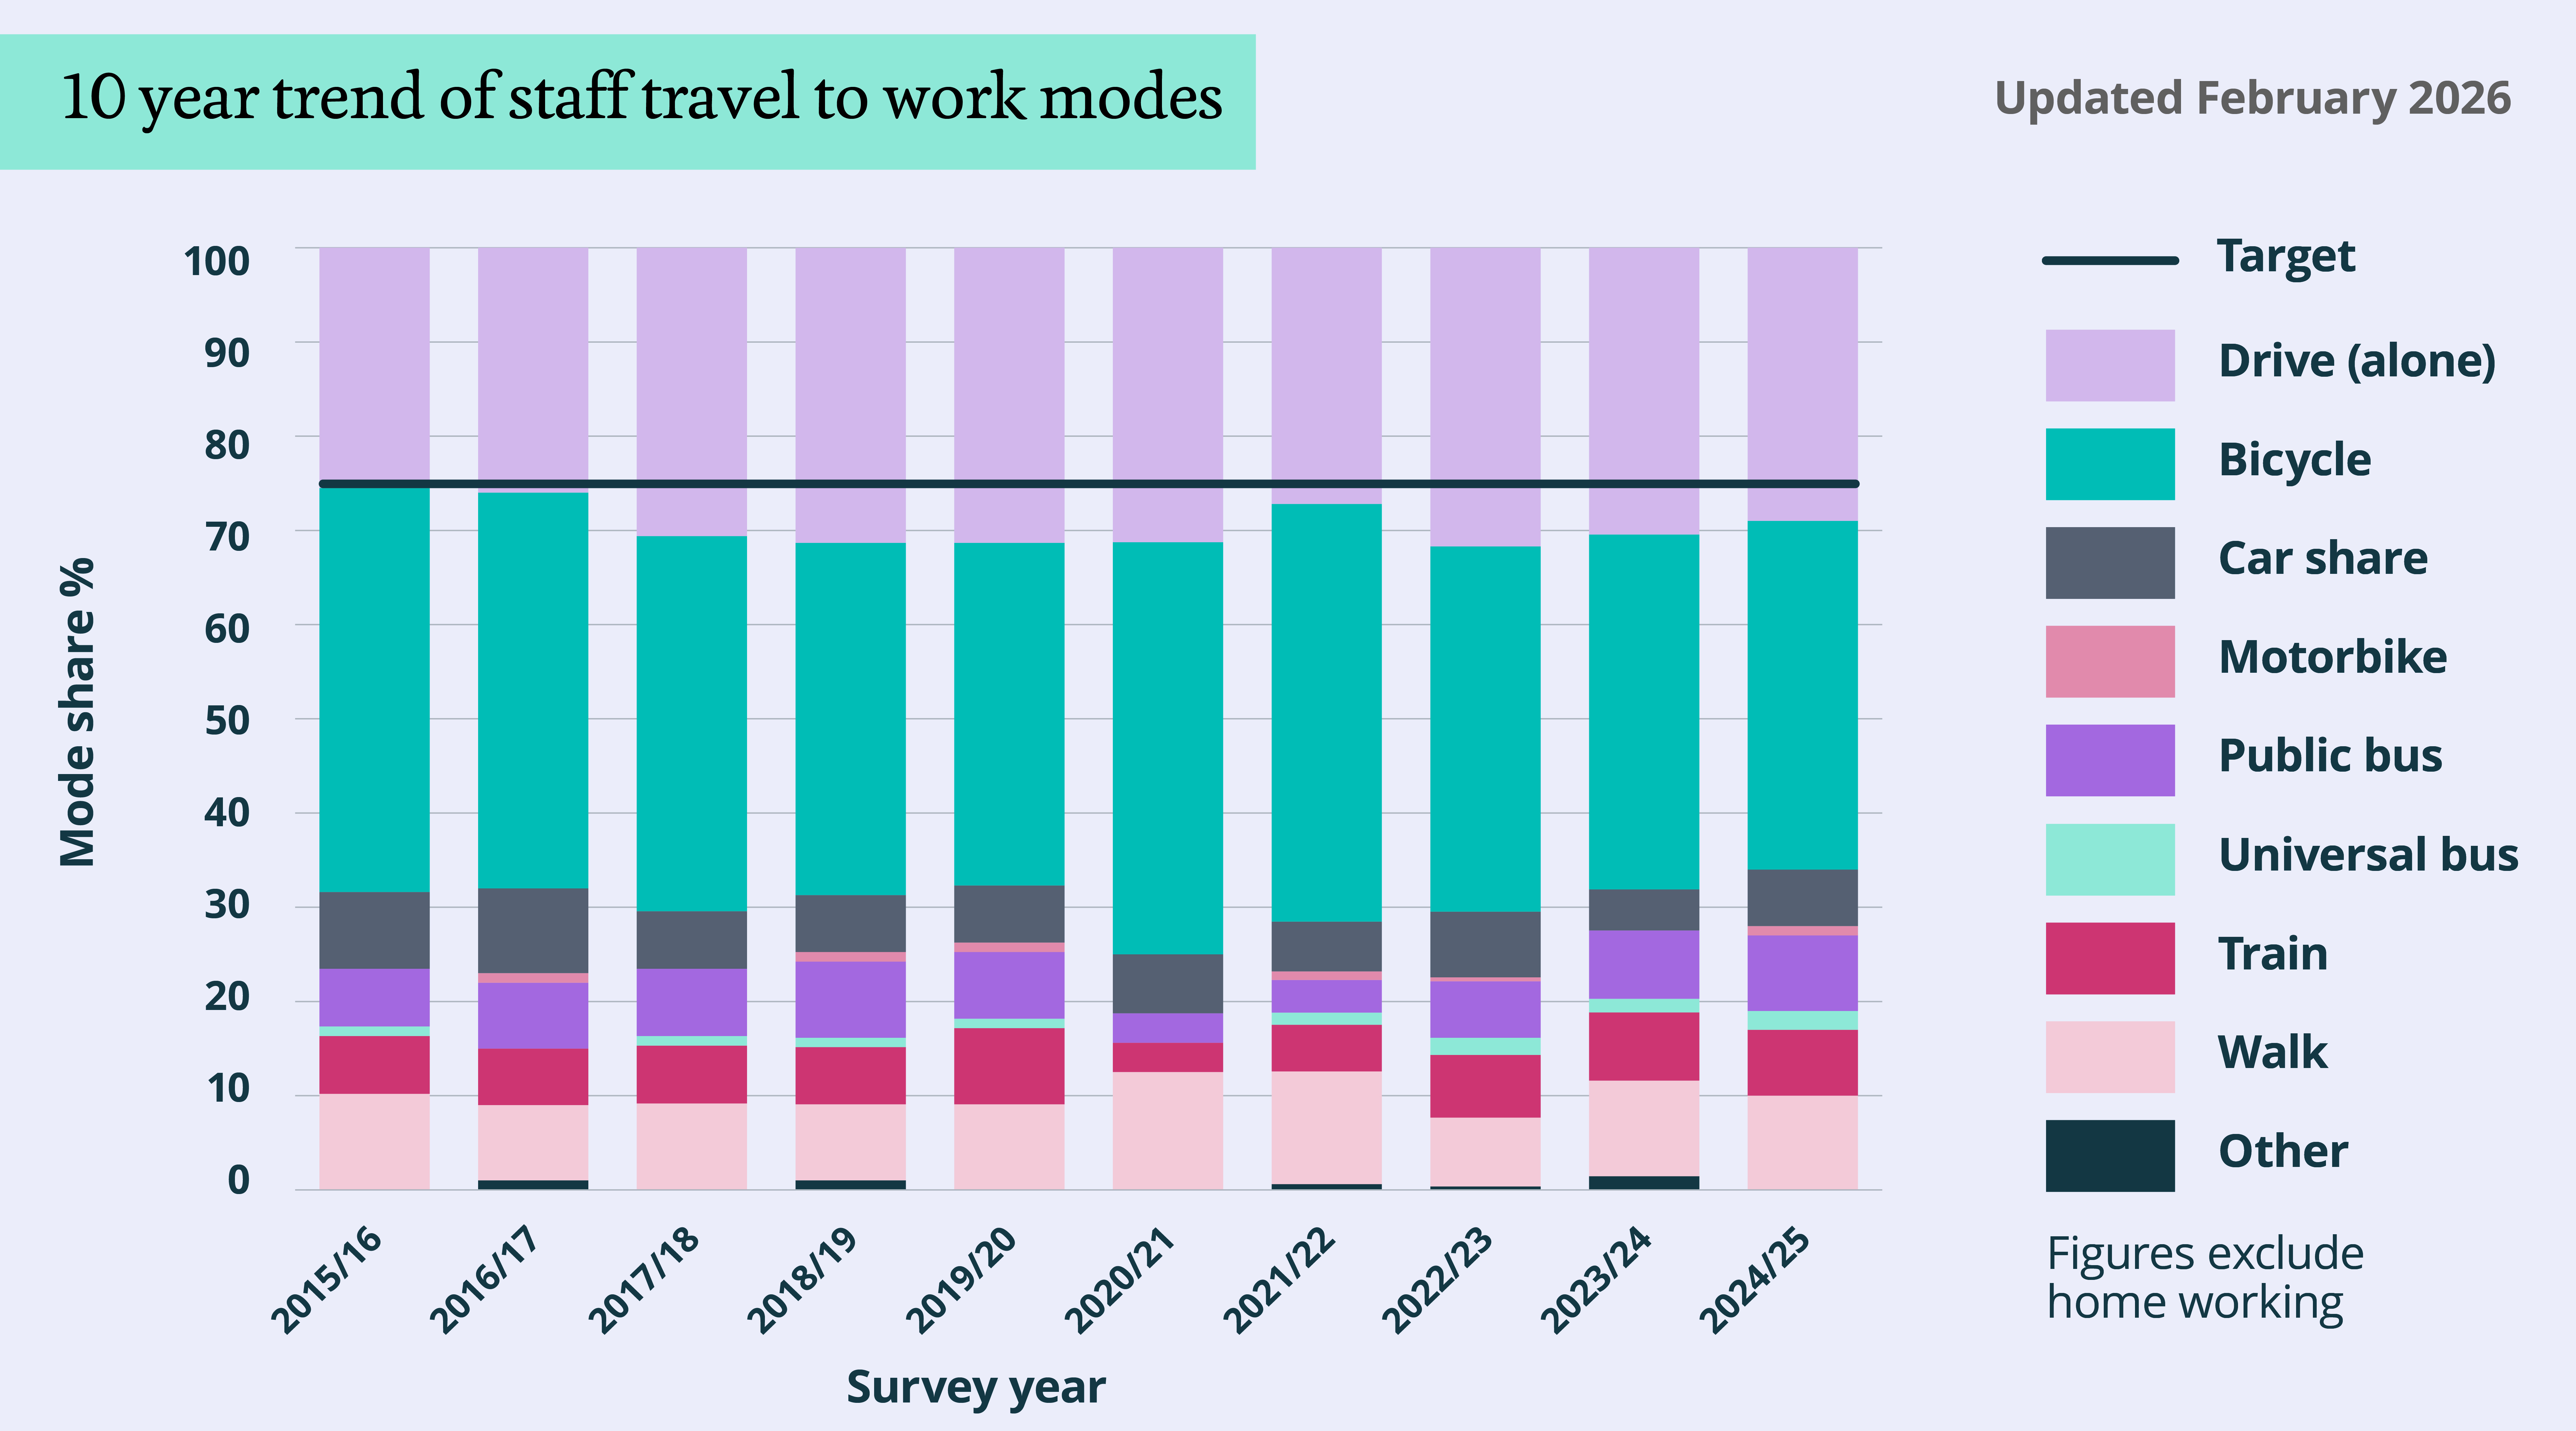
The following graph shows the 10-year trend in staff travel modes compared to our 75% sustainable travel target, excluding those working from home.
Summary
- The target was very close to being achieved in 2015, 2016 and most recently in 2021.
- The target was relatively close to being achieved in all of the other years.
- The worst year was 2022 at 68%, with an improvement in 2024 to 71%.
A breakdown of staff travel modes for October 2024
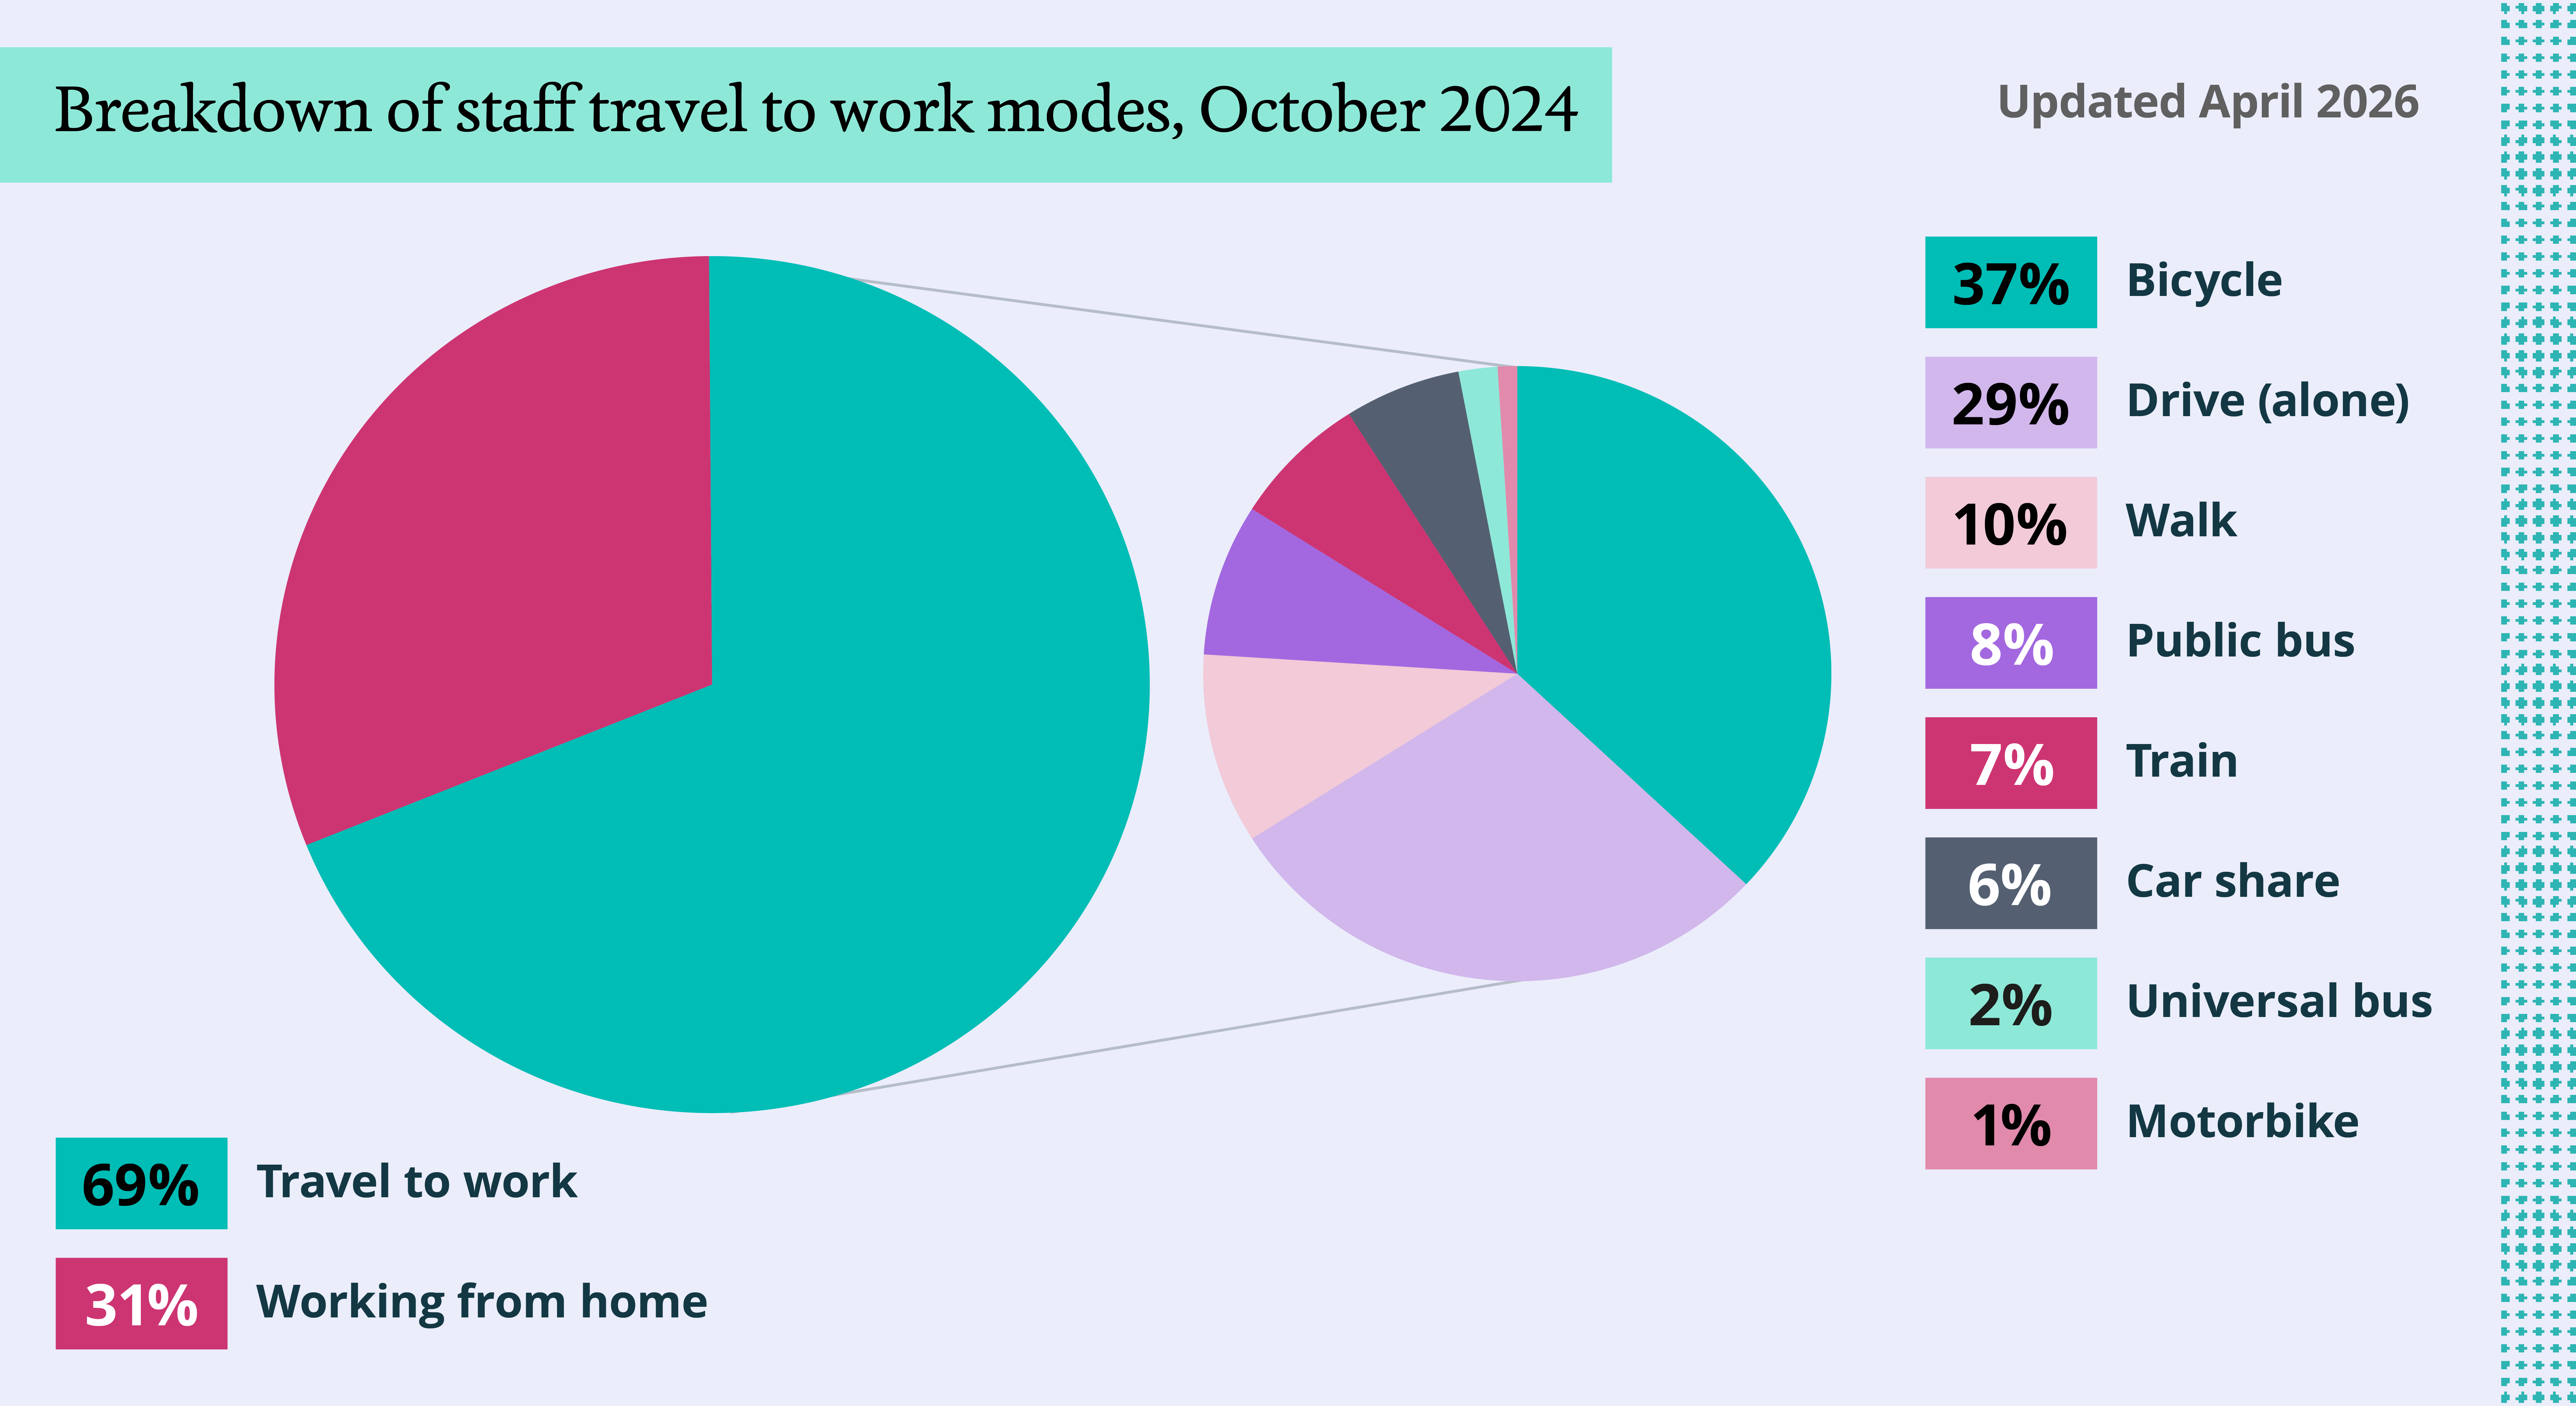
The following graph shows a breakdown of staff travel modes in October 2024. The pie chart on the left shows the percentages of staff travelling to work and working from home. Of the staff traveling to work, the pie chart on the right shows a breakdown of their travel modes.
Summary
- A significant percentage of staff are working from home at 31%.
- Of those that travel to work, the most common travel mode is bicycle at 37%, followed by driving alone (29%) and walking (10%).
- Of those that travel to work, the Transport Strategy target of 75% of staff regularly commuting by sustainable modes has not been achieved. The most recent figure in October 2024 is 71%.
Business travel
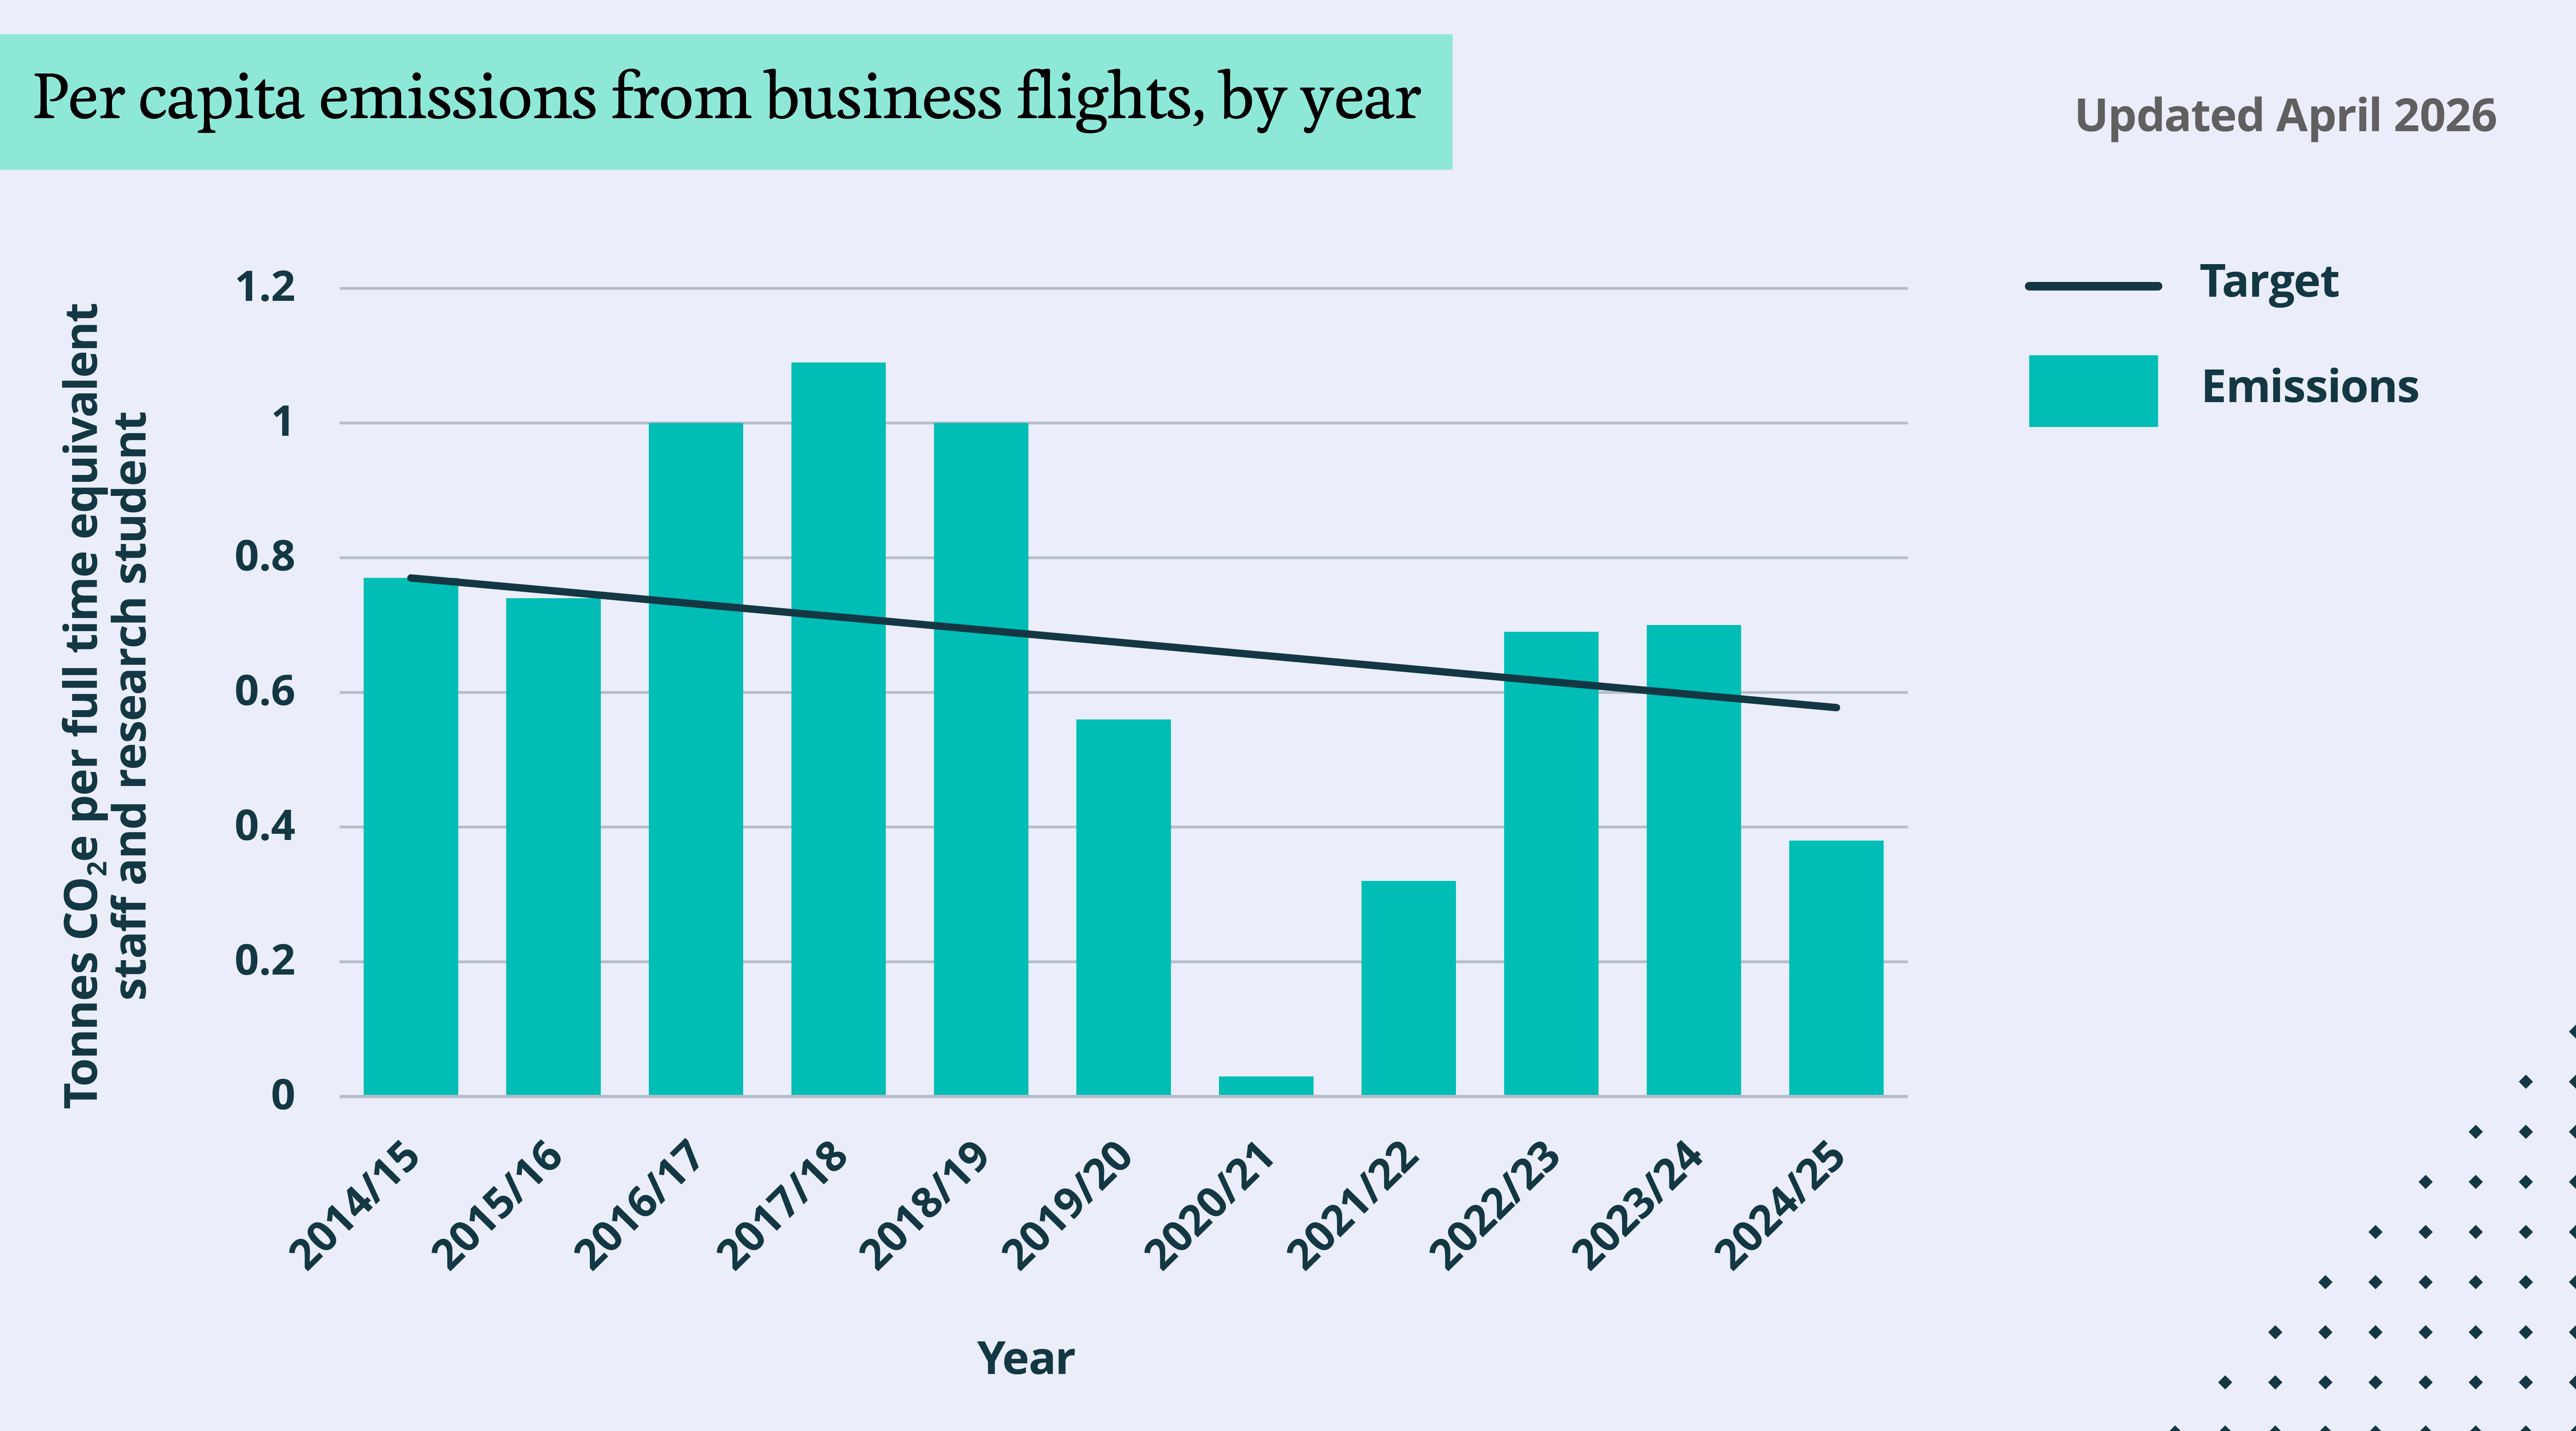
The following graph shows the University's target and actual total business flight emissions in tonnes per full-time equivalent (FTE) staff and research student, by year.
Summary
- The University’s target was to reduce business flight emissions per full time equivalent (FTE) staff and research students by 25% from 2014-15 levels by 2024-25, and this has now been achieved.
- In the baseline year, average FTE flight emissions were 0.77 tCO₂e. This has reduced by 51%, to 0.38 tCO₂e per FTE. This is the first year since the Covid related reductions that an on target reduction has been reported.
- Around 81% of the reduction in reported emissions since the baseline can be attributed to lower government emission factors. Government flight emission factors have reduced over the decade as aircraft efficiency, passenger load and routing have improved (with notable post Covid effects, particularly between 2023-24 and 2024-25). As a result, flights are now calculated as being around 29% less emission intensive per km than in the baseline year.
- The remaining 19% of the reduction is due to our own activity changes within the University. Because total air travel distance is slightly higher than in the baseline year (around a 2% increase), this activity driven reduction is likely to result mainly from shifts in ticket class mix, rather than from flying fewer kilometres. However, short haul flight distance has reduced, by almost 60% since the baseline year. The largest drop is in short haul business class travel, which has fallen by nearly 90%, showing a major shift away from higher impact seating options. Total short haul emissions have reduced by 70%. These changes are likely influenced by reductions in non-essential travel and reductions in short haul flights, attributable to increased rail travel.
- Work is underway to improve methodologies and rebuild a consistent, accurate understanding of this emission source and the opportunities to reduce it. This includes developing clearer processes and tools to ensure data is collected consistently and to maximise opportunities to further reduce emissions from business travel.
Additional and historic data
Additional and historic data can be found in our Previous annual reporting and in the University of Cambridge Annual Reports and Financial Statements.
For our commitments and approach, please visit the Travel and transport page.