Alt Text:
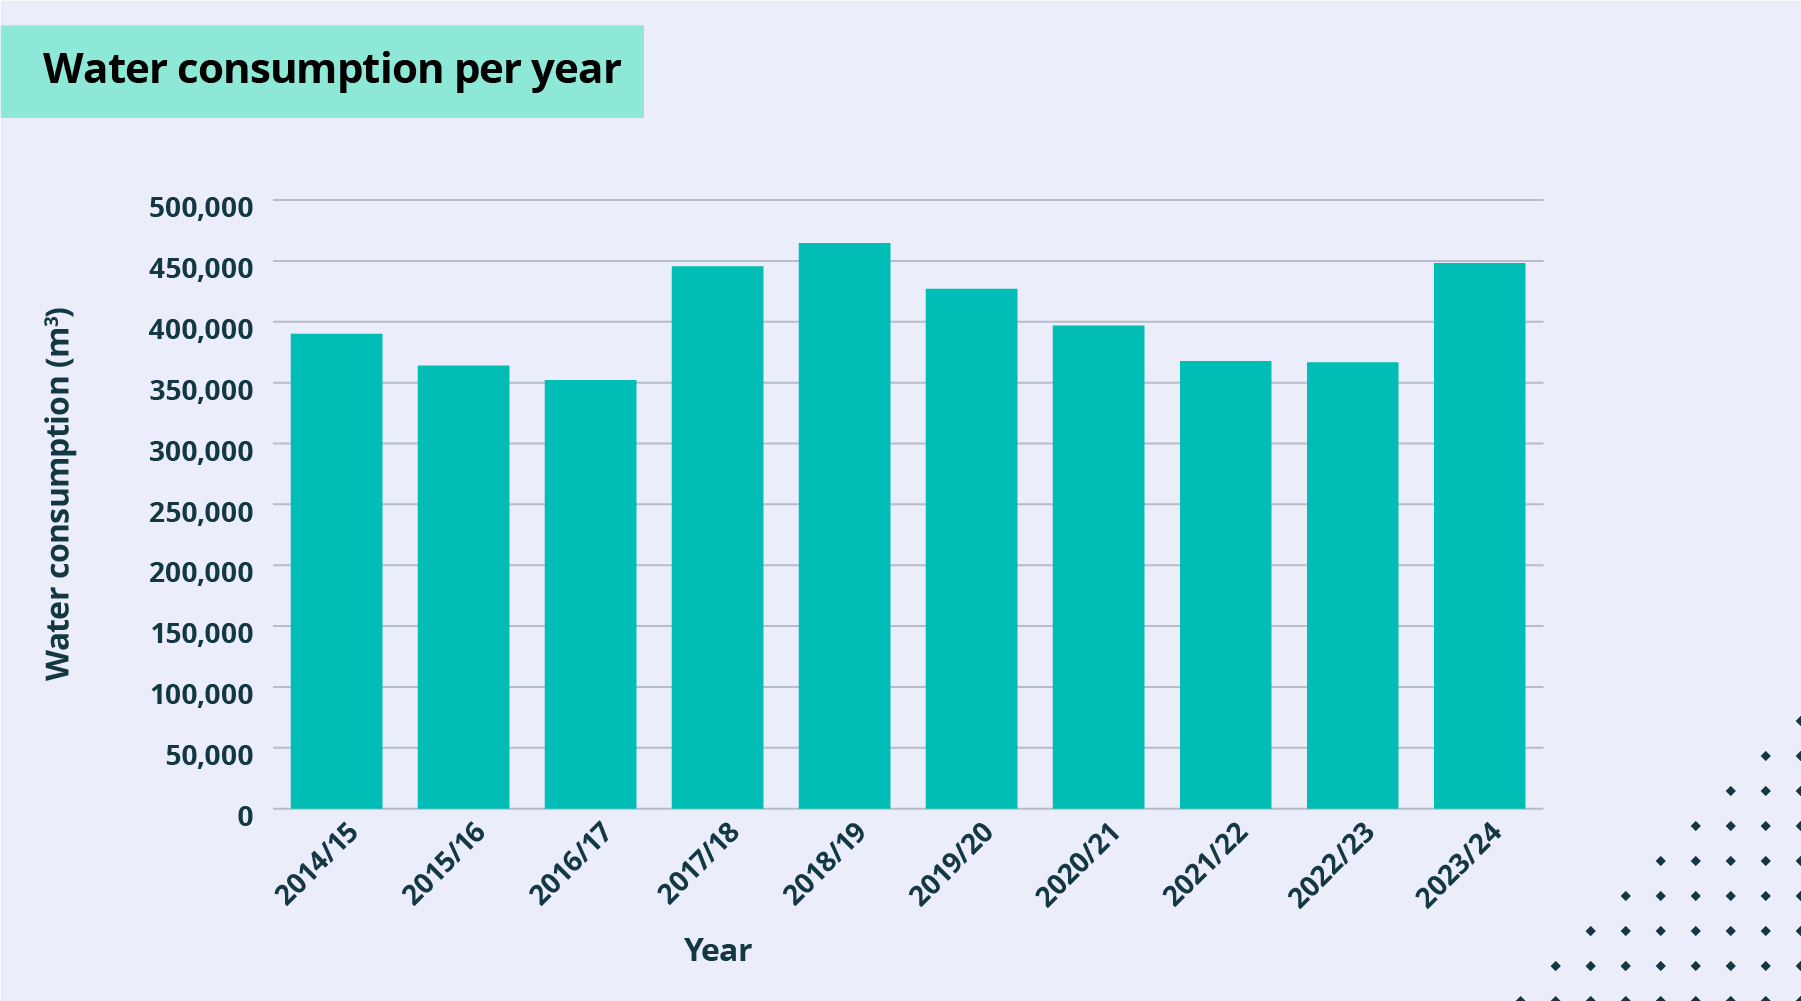
Bar chart showing total water consumption per year in metres cubed. Water consumption increased from 400,000 in 2014-15 to just above 450,000 in 2018-19, before dropping to just above 350,000 in 2022-23. Levels have gone to just below 450,000 in 2023-24.