Alt Text:
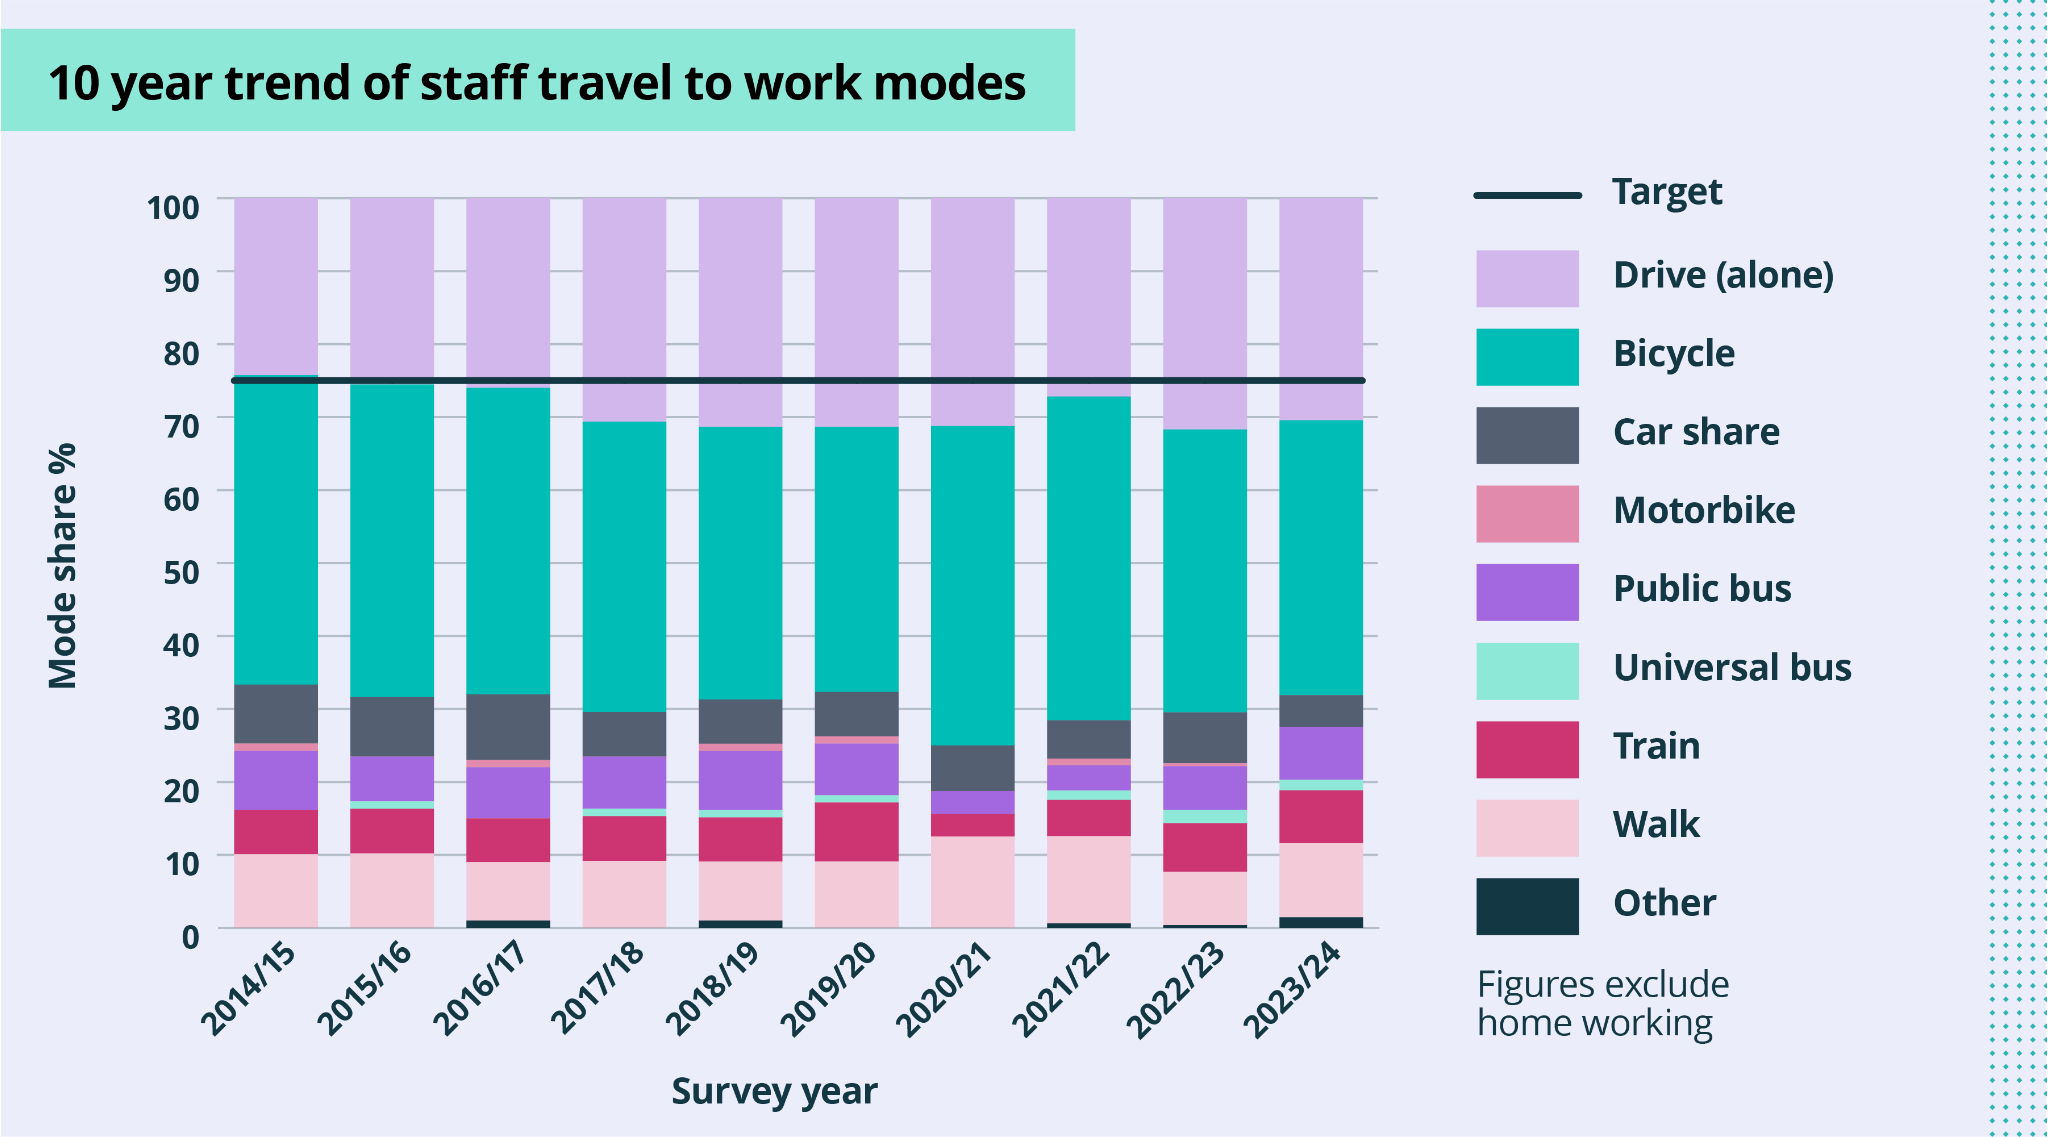
Bar chart shows percentage of staff travelling to work via different modes per year. Modes are in different colours and stacked on top of each other per bar. Target line of 75% sustainable travel each year. Largest mode is consistently by bicycle